

College Football TV Ratings
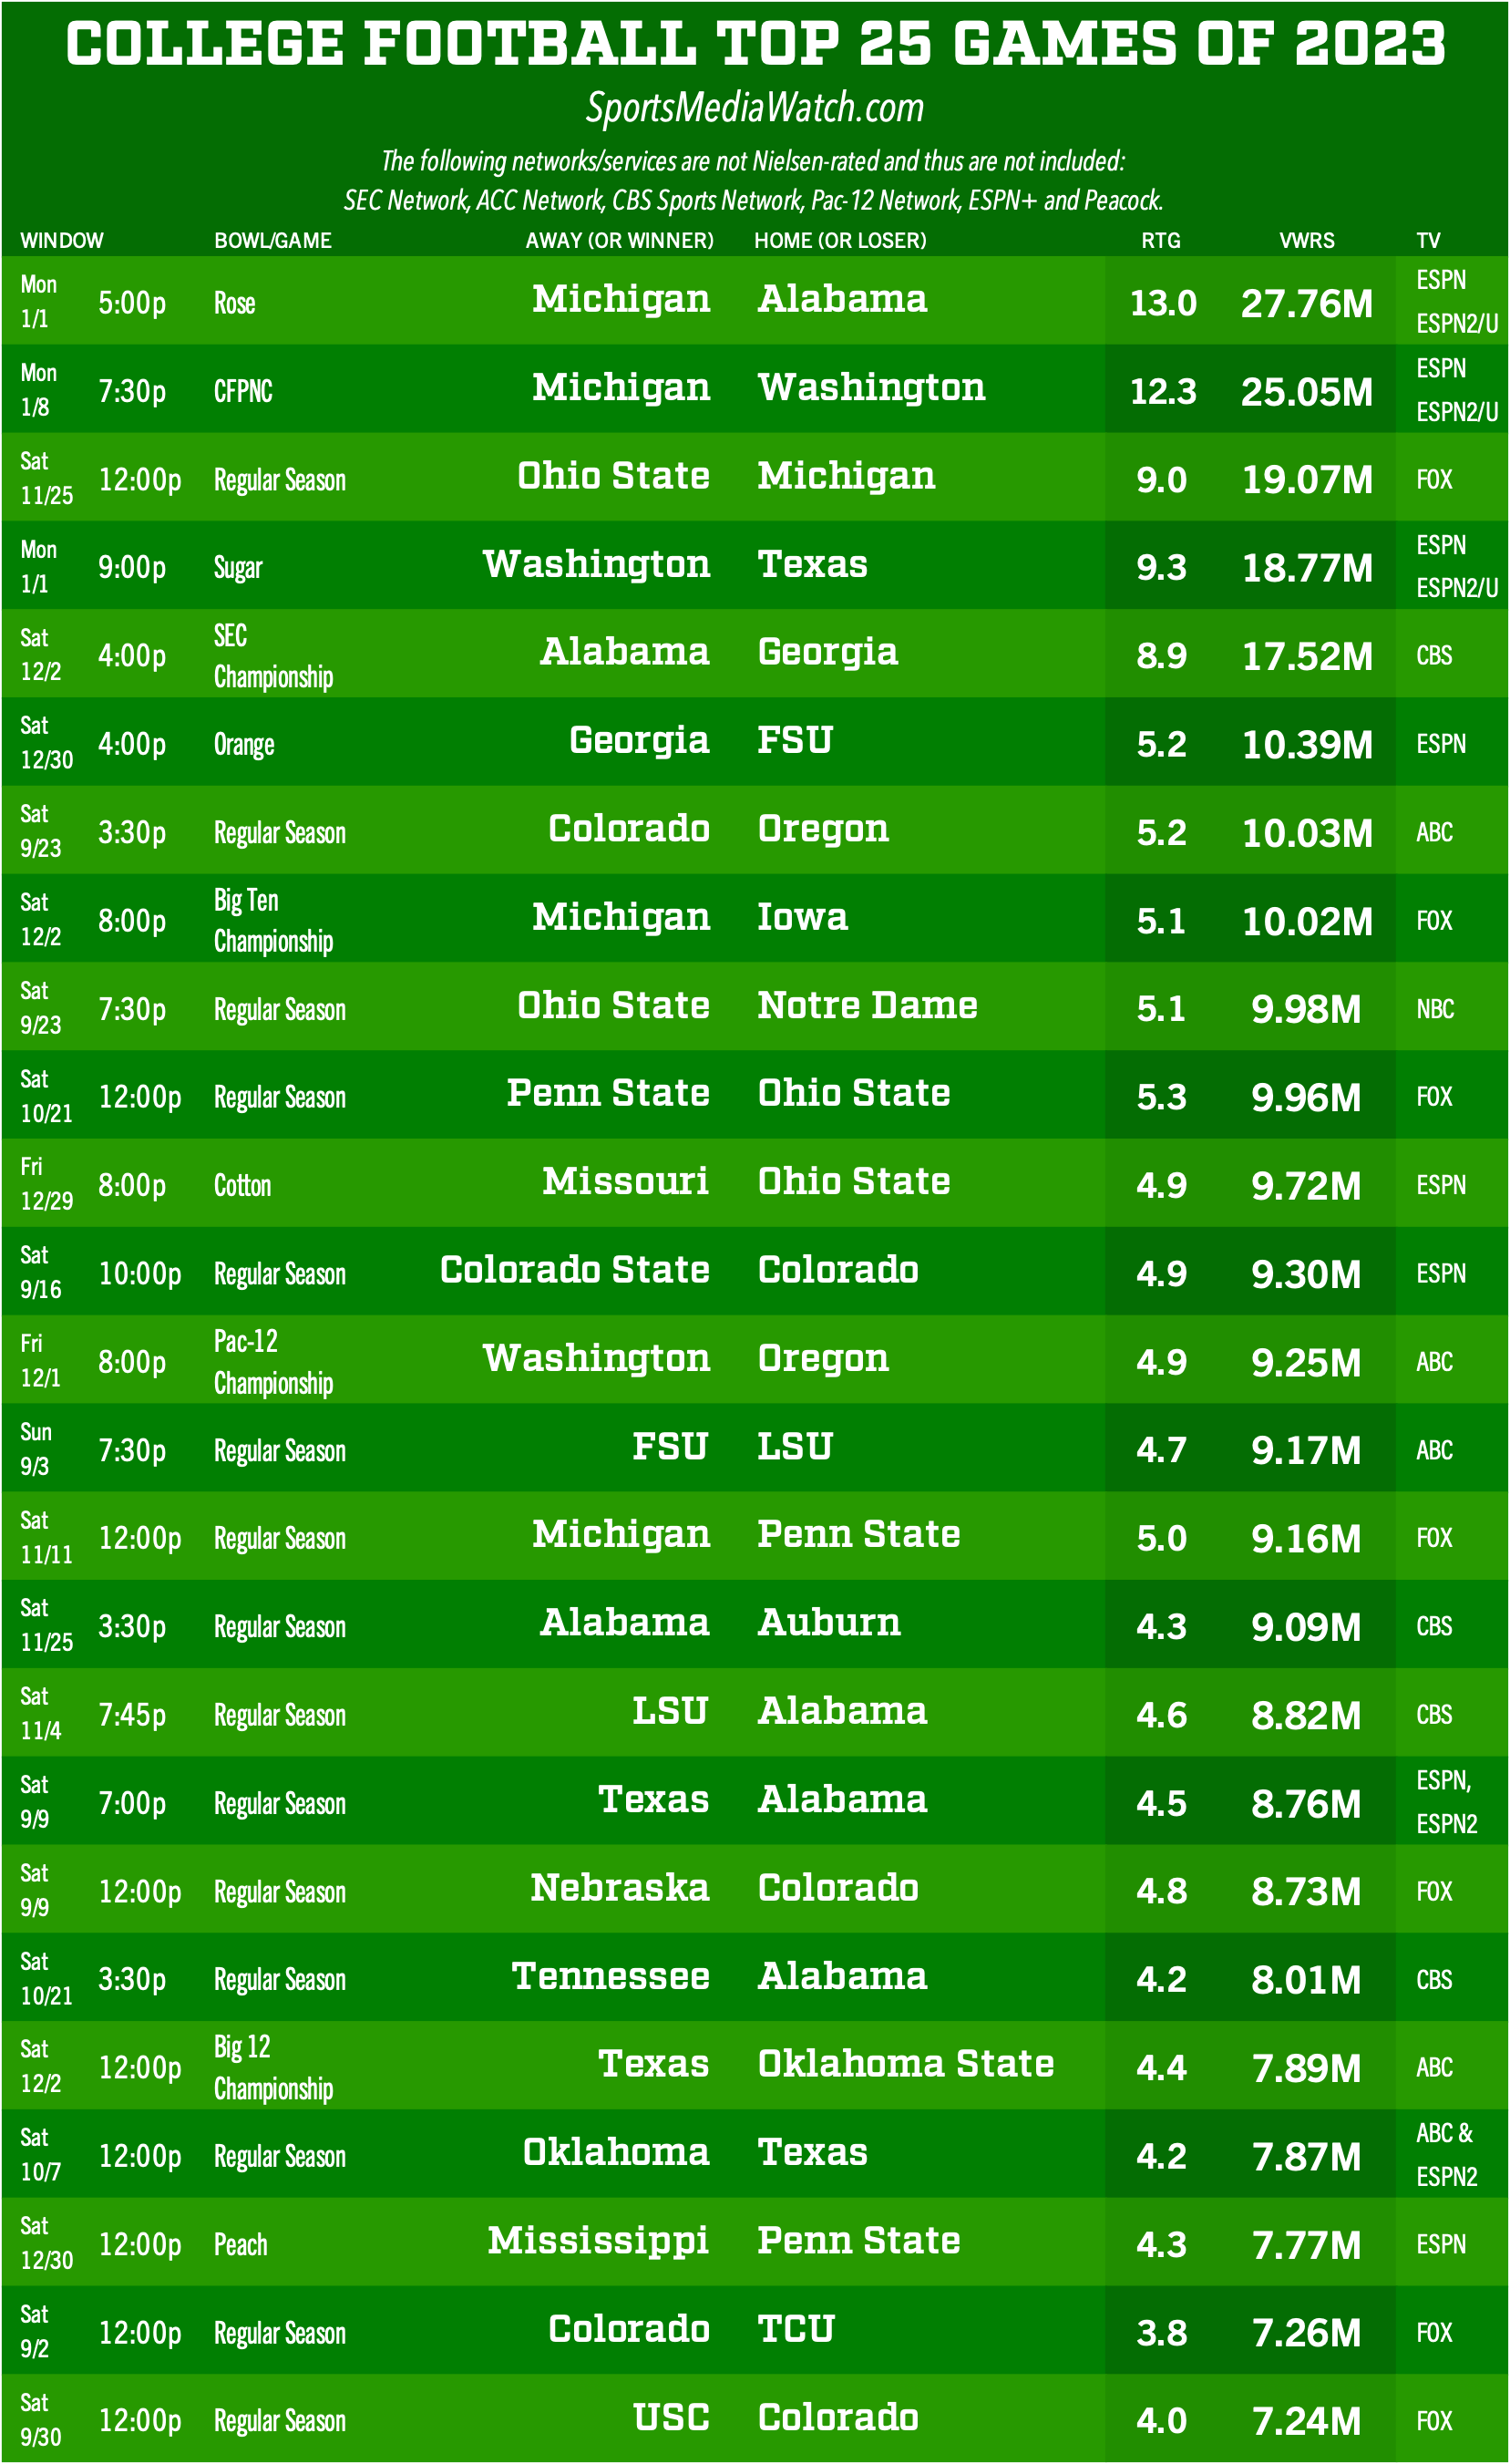
College football TV ratings for the 2023 regular season, bowls, College Football Playoff and National Championship.
 www.sportsmediawatch.com
I threw all of the data from this source together in a spreadsheet. One big difference though, I am counting OU and TEX as SEC teams, and BYU/UCF/CINCI/HOU as Big 12 teams. Any games or viewers not included in this source data are considered too insignificant to matter.
Take it all with a grain of salt, numbers are a bit all over the place in the early season and the methods aren't perfect either. I was just bored at work and this seemed fun and interesting. I'm sure there are plenty of flaws with the methodology. I'd look at it in terms of which conferences/teams are earning the most exposure... so far.
Rules:
- OU and Texas are SEC teams
- BYU/UCF/HOU/CINCI are B12 teams (The Expansion 4)
- Total Viewers for non-con 'crossover' games are awarded to each conference involved
- Total viewers for conference games are rewarded just once. Example: OSU and Minnesota game doesn't get counted twice just because 2 B1G teams are involved.
Total Viewers by Conference by Week:
| Week # | ACC | B1G | Big 12 | PAC | SEC |
| Week 0 | 3,217,000.00 | 976,000.00 | |||
| Week 1 | 27,945,000.00 | 18,223,000.00 | 4,267,000.00 | 5,357,000.00 | 26,752,000.00 |
| Week 2 | 2,890,000.00 | 18,984,000.00 | 7,206,000.00 | 20,728,000.00 | 13,653,000.00 |
| Week 3 | 8,373,000.00 | 22,399,000.00 | 6,588,000.00 | 3,081,000.00 | 25,079,000.00 |
| Grand Total | 39,208,000.00 | 62,823,000.00 | 18,061,000.00 | 30,142,000.00 | 65,484,000.00 |
Games > 3+ Million Views:
Rank | Week | Away/Home | Viewers/game |
1 | Week 1 | UGA/CLEM | 8,863,000.00 |
2 | Week 3 | ALA/UF | 7,863,000.00 |
3 | Week 1 | ND/FSU | 7,751,000.00 |
4 | Week 2 | OREG/OSU | 7,730,000.00 |
5 | Week 3 | AUB/PSU | 7,606,000.00 |
6 | Week 1 | OSU/MINN | 6,295,000.00 |
7 | Week 1 | ALA/MIAMI | 5,674,000.00 |
8 | Week 1 | PSU/WISC | 5,409,000.00 |
9 | Week 2 | WASH/MICH | 4,748,000.00 |
10 | Week 2 | TAMU/COLO | 4,502,000.00 |
11 | Week 3 | NEB/OU | 4,210,000.00 |
12 | Week 2 | IOWA/ISU | 3,890,000.00 |
13 | Week 2 | TEXAS/ARK | 3,356,000.00 |
14 | Week 1 | LSU/UCLA | 3,219,000.00 |
15 | Week 0 | NEB/ILL | 3,217,000.00 |
16 | Week 1 | LOU/MISS | 3,078,000.00 |
Big 12 in Review:
| Category | Total Viewers |
| Former Big 12 | 22,695,000.00 |
| Gains (BYU, UC, UH, UCF) | 8,337,000.00 |
| Losses (OU, UT) | (12,971,000.00) |
| Net Viewers | 18,061,000.00 |
Top 5 Big 12 Games:
| Week | Away/Home | Viewers/game |
| Week 2 | IOWA/ISU | 3,890,000.00 |
| Week 3 | UCF/LOU | 1,881,000.00 |
| Week 3 | CINCI/IND | 1,681,000.00 |
| Week 2 | UTAH/BYU | 1,503,000.00 |
| Week 3 | ASU/BYU | 1,498,000.00 |
The SEC's top 2 games alone so far this year practically match the total viewership of the entire new Big 12. Again, grain of salt, but... yikes...
