ADVERTISEMENT

Why America Sucks at Everything

I think claiming what the Dems what is an open borders policy is much like the socialists comments from the right. They are statements they make without thought because they are too simple minded to understand semi-complex ideas.

Saying a wall won't work and we shouldn't separate children of illegal immigrants from their parents isn't advocating open borders.

Much in the same way that government run healthcare is not socialism.

That said to be entirely fair the Democrats do a similar thing with abortion, thinking that if we don't have legal abortion we are turning women into property.

What's so "semi-complex" about enforcing the immigration laws passed by Congress?
 
Yeah...they can allot billions to "free" healthcare for everyone...they don't have to spend billions upon billions for self defense. They know Uncle Sam is taking care of that for them. Meanwhile the American veterans who were stationed in their countries get substandard care at the VA back home.
You know how many of these socialist bozos don't know that or pretend it's not a big deal?
We spend way too much on "defense" costs imo. Way too much.

I'd rather cut and spend it on education imo.
 
He makes a lot of statements with no sources. Having actually lives in a couple of the countries cited, I can conform that we have a lower cost of living and a much better quality of life on average. That's my own personal experience.

Interesting video to think about. In the few areas I have more knowledge of it was a disingenuous representation.
 
I agree with the gist of this video which is sort of unexpected after reading the title. It's basically saying Americans spend more, in terms of taxes and so on, for less than any other country (especially when you include health care costs).

The problem imo is the government wastes a tremendous amount of money and is very inefficient. Things like lobbying, honest graft, political favors, special programs and so forth, that shouldn't be allowed at all, make it so congress's interests, having too much motivation for their own personal profit, don't align with the people well enough. Need to get rid of all of it.

There's also a myth that any spending is good. Not that all spending is bad, don't conflate that, but there is way too much wasteful spending. For the amount we already spend including health costs, all taxes federal, state and local (or close, I'm guessing here, need to look at everything as a % of GDP including health costs) we could afford the infrastructure, health care, safety nets and so on, comparable to Europe or Canada. We already spend twice as much as most countries on health care in terms of GDP (about 18% US vs about 9% in Europe), so that's a big one.
 
Last edited:
Interesting video. One thing....as far as his “how much each country pays in taxes” I don’t think he’s including VAT or Value added tax that Germany and other countries have. For instance Germany has a 19% VAT on goods and services on top of their income taxes.
Except that he mentions sale tax when talking about what people pay which is essentially what the VAT is.
 
Also, the problem with health care is it's basically the privatization of socialism. There's a reason an x-ray costs 4 times as much in the US as it does in Europe. It's because we have allocated way too much money to health care (and admin) over time. Meaning, insurance premiums have been allowed to go up at a rate much more than inflation, thus making the health care pie itself way too big. This has allowed costs to get out of control over time. In the late 1950's health care was 5% of GDP and now close to 20% (more than anybody in the world AINEC). Too much money (allocated to a specific industry) chasing too few goods and services.
 
Except that he mentions sale tax when talking about what people pay which is essentially what the VAT is.
He mentions it but wherever he got his 26% figure for Great Britain seems a little off.....

Standard VAT alone is 20%


Income Tax

Gross salary £25,000
After tax £20,279
Tax rate 18.9%


Gross salary £40,000
After tax £30,480
Tax rate 24.8%

Gross salary £100,000
After tax £65,780
Tax rate 34.3%


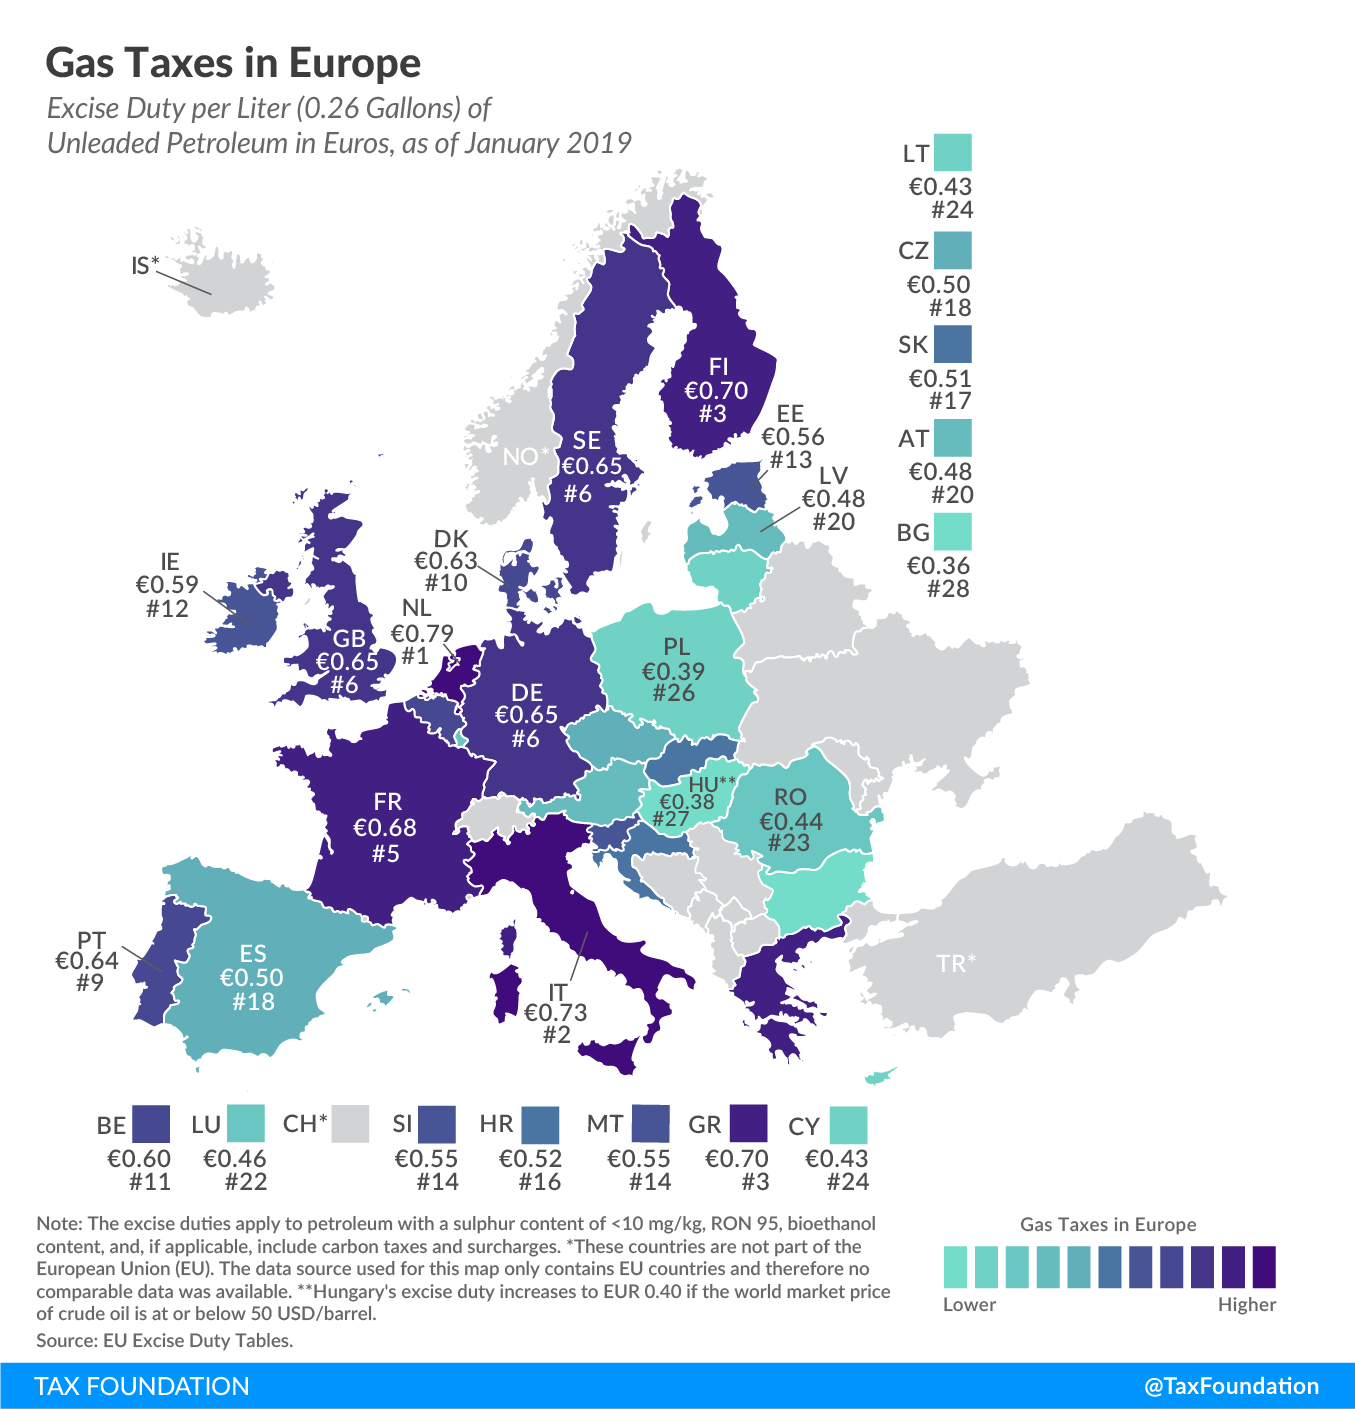
Gas Tax in Great Britain is the equivalent of $2.90 per gallon


They also make National Insurance Contributions

British workers pay their share of NI contributions to build up an entitlement over time for later payment of a pension and other government benefits such as a maternity allowance.


In 2020, the rate was 12% of the worker's weekly earnings between the equivalent of about $220 a week and about $1,200, dropping to 2% above that maximum.


Oh mah gawd. Are you seriously telling me that a video posted by flick shagwell featuring David Cross about how bad America is…………..is not accurate?

Mind Blown

Next thing you know, you will be telling me that Menace Sockeyes bought in hook line and sinker while insulting people who disagreed with that premise.
 
Also, the problem with health care is it's basically the privatization of socialism. There's a reason an x-ray costs 4 times as much in the US as it does in Europe. It's because we have allocated way too much money to health care (and admin) over time. Meaning, insurance premiums have been allowed to go up at a rate much more than inflation, thus making the health care pie itself way too big. This has allowed costs to get out of control over time. In the late 1950's health care was 5% of GDP and now close to 20% (more than anybody in the world AINEC). Too much money (allocated to a specific industry) chasing too few goods and services.
.we also subsidize those wonderful free health systems in Europe by paying more for literally everything in the US on the consumer side and are largely responsible for the majority of research and development. Nice of places like Europe and Canada to cap what can be charged for a drug for example where the burden of that cost is shifted to American consumers. So awesome for videos like this saying we suck when we are paying for ours and theirs as well
 
  • Like
Reactions: goldmom
Oh mah gawd. Are you seriously telling me that a video posted by flick shagwell featuring David Cross about how bad America is…………..is not accurate?

Mind Blown

Next thing you know, you will be telling me that Menace Sockeyes bought in hook line and sinker while insulting people who disagreed with that premise.
So the a quibbling by some here on the British figure renders the entire thing moot? Next you’ll tell me Ronald Mexico is too dumb understand the entire premise.
 
He makes a lot of statements with no sources. Having actually lives in a couple of the countries cited, I can conform that we have a lower cost of living and a much better quality of life on average. That's my own personal experience.


A groundbreaking study by Just Facts has discovered that after accounting for all income, charity, and non-cash welfare benefits like subsidized housing and Food Stamps—the poorest 20% of Americans consume more goods and services than the national averages for all people in most affluent countries. This includes the majority of countries in the prestigious Organization for Economic Cooperation and Development (OECD), including its European members. In other words, if the U.S. “poor” were a nation, it would be one of the world’s richest.

Notably, this study was reviewed by Dr. Henrique Schneider, professor of economics at Nordakademie University in Germany and the chief economist of the Swiss Federation of Small and Medium-Sized Enterprises. After examining the source data and Just Facts’ methodology, he concluded: “This study is sound and conforms with academic standards. I personally think it provides valuable insight into poverty measures and adds considerably to this field of research.”

The “Poorest” Rich Nation?​

In a July 1st New York Times video op-ed that decries “fake news” and calls for “a more truthful approach” to “the myth of America as the greatest nation on earth,” Times producers Taige Jensen and Nayeema Raza claim that the U.S. has “fallen well behind Europe” in many respects and has “more in common with ‘developing countries’ than we’d like to admit.”

“One good test” of this, they say, is how the U.S. ranks in the OECD, a group of “36 countries, predominantly wealthy, Western, and Democratic.” While examining these rankings, they corrupt the truth in ways that violate the Times’ op-ed standards, which declare that “you can have any opinion you would like,” but “the facts in a piece must be supported and validated,” and “you can’t say that a certain battle began on a certain day if it did not.”

A prime example is their claim that “America is the richest country” in the OECD, “but we’re also the poorest, with a whopping 18% poverty rate—closer to Mexico than Western Europe.” That assertion prompted Just Facts to conduct a rigorous, original study of this issue with data from the OECD, the World Bank, and the U.S. government’s Bureau of Economic Analysis. It found that the Times is not merely wrong about this issue but is reporting the polar opposite of reality.

Poor Compared to Who?​

The most glaring evidence against the Times’ rhetoric is a note located just above the OECD’s data for poverty rates. It explains that these rates measure relative poverty within nations, not between nations. As the note states, the figures represent portions of people with less than “half the median household income” in their own nations—and thus—”two countries with the same poverty rates may differ in terms of the relative income-level of the poor.”

The upshot is laid bare by the fact that this OECD measure assigns a higher poverty rate to the U.S. (17.8%) than to Mexico (16.6%). Yet, World Bank data shows that 35% of Mexico’s population lives on less than $5.50 per day, as compared to only 2% of people in the United States.

Hence, the OECD’s poverty rates say nothing about which nation is “the poorest.” Nonetheless, this is exactly how the Times misrepresented them.
 
So the a quibbling by some here on the British figure renders the entire thing moot? Next you’ll tell me Ronald Mexico is too dumb understand the entire premise.
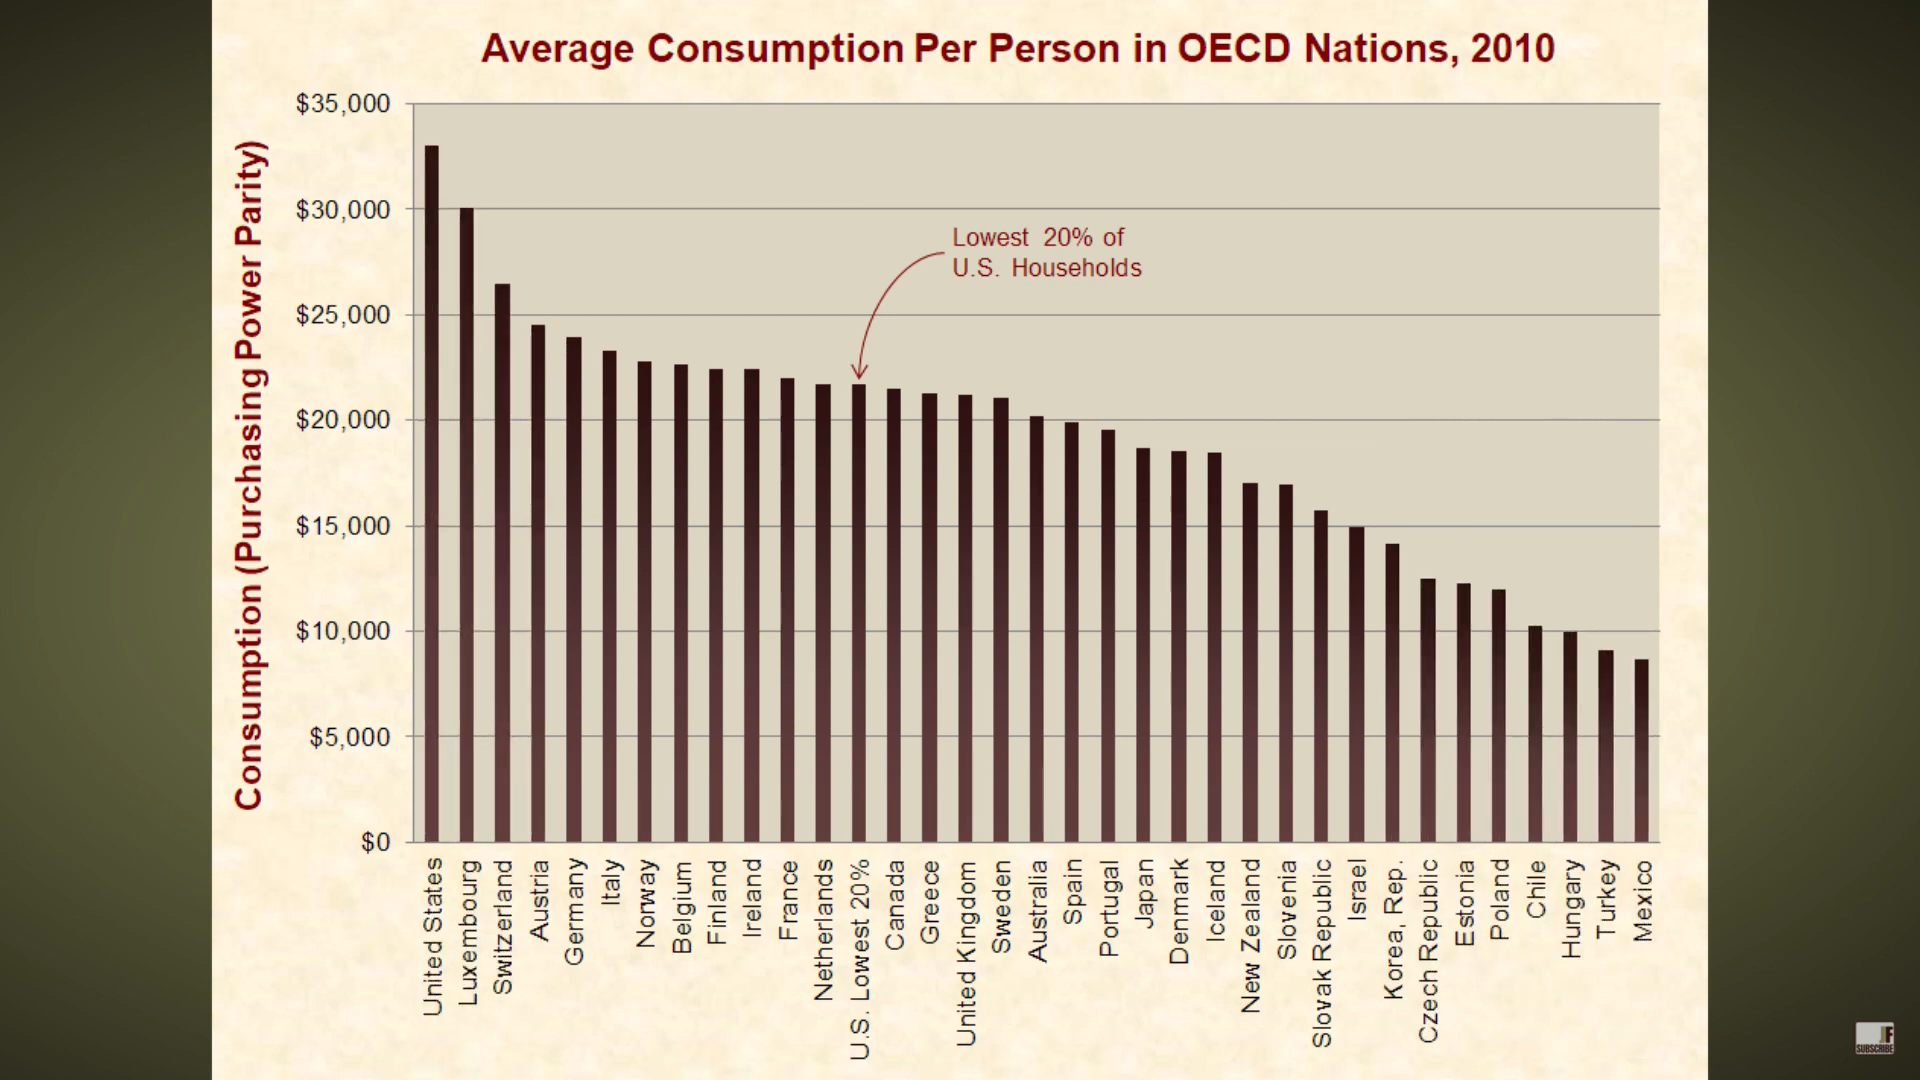
Can you explain this graph to the rest of the class?

H5srCus.png
 
"least effective healthcare"...
Dont conflate unhealthy practices of the individual with healthcare.

Not that I would ever look to a comedian for any sort of valuable politcal, social, cultural insight (or any insight for that matter).
 
  • Like
Reactions: jamesvanderwulf
"least effective healthcare"...
Dont conflate unhealthy practices of the individual with healthcare.

Not that I would ever look to a comedian for any sort of valuable politcal, social, cultural insight (or any insight for that matter).
You think he wrote that piece? LOL!


A groundbreaking study by Just Facts has discovered that after accounting for all income, charity, and non-cash welfare benefits like subsidized housing and Food Stamps—the poorest 20% of Americans consume more goods and services than the national averages for all people in most affluent countries. This includes the majority of countries in the prestigious Organization for Economic Cooperation and Development (OECD), including its European members. In other words, if the U.S. “poor” were a nation, it would be one of the world’s richest.

Notably, this study was reviewed by Dr. Henrique Schneider, professor of economics at Nordakademie University in Germany and the chief economist of the Swiss Federation of Small and Medium-Sized Enterprises. After examining the source data and Just Facts’ methodology, he concluded: “This study is sound and conforms with academic standards. I personally think it provides valuable insight into poverty measures and adds considerably to this field of research.”

The “Poorest” Rich Nation?​

In a July 1st New York Times video op-ed that decries “fake news” and calls for “a more truthful approach” to “the myth of America as the greatest nation on earth,” Times producers Taige Jensen and Nayeema Raza claim that the U.S. has “fallen well behind Europe” in many respects and has “more in common with ‘developing countries’ than we’d like to admit.”

“One good test” of this, they say, is how the U.S. ranks in the OECD, a group of “36 countries, predominantly wealthy, Western, and Democratic.” While examining these rankings, they corrupt the truth in ways that violate the Times’ op-ed standards, which declare that “you can have any opinion you would like,” but “the facts in a piece must be supported and validated,” and “you can’t say that a certain battle began on a certain day if it did not.”

A prime example is their claim that “America is the richest country” in the OECD, “but we’re also the poorest, with a whopping 18% poverty rate—closer to Mexico than Western Europe.” That assertion prompted Just Facts to conduct a rigorous, original study of this issue with data from the OECD, the World Bank, and the U.S. government’s Bureau of Economic Analysis. It found that the Times is not merely wrong about this issue but is reporting the polar opposite of reality.

Poor Compared to Who?​

The most glaring evidence against the Times’ rhetoric is a note located just above the OECD’s data for poverty rates. It explains that these rates measure relative poverty within nations, not between nations. As the note states, the figures represent portions of people with less than “half the median household income” in their own nations—and thus—”two countries with the same poverty rates may differ in terms of the relative income-level of the poor.”

The upshot is laid bare by the fact that this OECD measure assigns a higher poverty rate to the U.S. (17.8%) than to Mexico (16.6%). Yet, World Bank data shows that 35% of Mexico’s population lives on less than $5.50 per day, as compared to only 2% of people in the United States.

Hence, the OECD’s poverty rates say nothing about which nation is “the poorest.” Nonetheless, this is exactly how the Times misrepresented them.
Amazing how often America gets called terrible and racist and the model that gets held up to follow is countries that are predominantly homogeneous and white with Western culture. Weird isn't it?
 
  • Like
Reactions: notlongago
It's a simple graph, Menace. What does it tell you?
Don't Bogart that big brain. Tell us what this graph shows. Ron might need your help.
That over a decade ago, Americans were spending way to much money? Help me, macroeconomics professor!
 
That over a decade ago, Americans were spending way to much money? Help me, macroeconomics professor!
The LOWEST 20% households by income (just a little bit more than the portion we consider in relative poverty) in the United States enjoy a consumption level ABOVE THE AVERAGE for the people in Canada, Greece, United Kingdom, Sweden, Australia, Spain, Portugal, Japan, Denmark, Iceland, New Zealand, Slovenia, Slovak Republic, Israel, Republic of Korea, Czech Republic, Estonia, Poland, Chile, Hungary, Turkey and Mexico.
And that consumption level is within spitting distance ($3k) of the AVERAGE consumption for the populations of the Netherlands, France, Ireland, Finland, Belgium, Norway, Italy, Germany and Austria.

Kind of weird you weren't willing to acknowledge this. Seems like it would be good news that someone would like to see. It's nice to see that our poorest enjoy a standard of living better than the average in most OECD countries, isn't it?
Wait, you think consumption = standard of living?!?!? Hahahahahahahaha!!!!!!!!!!

Let’s see how the richest country in the world is doing on that...


1Switzerland188.36
2Denmark186.25
3Netherlands180.27
4Finland178.95
5Australia178.41
6Iceland177.64
7Austria176.36
8Germany175.24
9New Zealand173.60
10Luxembourg171.81
11Norway171.72
12Estonia171.16
13Sweden170.19
14Oman168.82
15Slovenia165.74
16Japan164.06
17United States163.60
18Spain163.48
19Lithuania160.29
20Portugal159.83

 
Last edited:
Yeah...they can allot billions to "free" healthcare for everyone...they don't have to spend billions upon billions for self defense. They know Uncle Sam is taking care of that for them. Meanwhile the American veterans who were stationed in their countries get substandard care at the VA back home.
You know how many of these socialist bozos don't know that or pretend it's not a big deal?
Holy shit!
 
My ex is from Denmark. She was here for school, before she went to free med-school after Italy. She had been through all European counties. She told me this country is doomed. It is, and if you can’t see that you’re a fool. She said you’re raising alcoholic idiots that are clueless about the real world and education,
 
Wait, you think consumption = standard of living?!?!? Hahahahahahahaha!!!!!!!!!!

Let’s see how the richest country in the world is doing on that...


1Switzerland188.36
2Denmark186.25
3Netherlands180.27
4Finland178.95
5Australia178.41
6Iceland177.64
7Austria176.36
8Germany175.24
9New Zealand173.60
10Luxembourg171.81
11Norway171.72
12Estonia171.16
13Sweden170.19
14Oman168.82
15Slovenia165.74
16Japan164.06
17United States163.60
18Spain163.48
19Lithuania160.29
20Portugal159.83
Sweet index, want to explain to the class what those arbitrary numbers mean, and how they're formulated compared to the OECD's purchasing power parity?

You can start here and you don't have to get far to see how arbitrary it becomes.
 
I love the comparisons to homogeneously populated countries with 2% of our population and 4% of the land mass. Seems apt...
 
ADVERTISEMENT

Latest posts

ADVERTISEMENT