ADVERTISEMENT

Global warming...

Then maybe you should direct your ire toward the sensationalist media that causes people to be skeptical of the real science because of all the fake news regarding the science.

I've made that point dozens of times here; get your info from the sources (e.g. National Academies) not generic news stories. Some news stories get it right, some don't.

But that's no excuse for ignoring the actual science, simply because some news reporters do a crappy job of reporting actual facts.
 
Nope, that's not what the chart shows. Non-waterfront properties have almost caught up to pre-bust levels and waterfront homes still have a ways to go

That's exactly what he posted (maybe not exact percentages, but the relative trends and ratios), yet you're claiming he's wrong.
 
Joe, you realize what you are saying, don't you? Basically, it's that I'm not supposed to believe anything I read about this unless it's something you wrote, because only you are capable of determining what is credible and what is not.

No; you should ignore the Op Eds and go to the actual science projections and predictions. You've bashed on the IPCC several times now, but their projections have all been shown to be very accurate.
 
That's exactly what he posted (maybe not exact percentages, but the relative trends and ratios), yet you're claiming he's wrong.

That's because he's ignoring the rest of the story (the same part you deleted from my post).

The prices for waterfront houses were more inflated than non-waterfront houses before the bust, so the waterfront houses have more ground to make up.
 
I haven't seen "clear evidence" of either of those things. The only thing I've seen "clear evidence" of is that it was NOT of zero concern, virtually or otherwise. Had there been zero concern about it, there would have been zero presumably credible sources talking about it and thus zero stories about it in respected national magazines. So the one thing I think we CAN establish is that your claim that there was virtually zero concern is untrue.

It is not true that where there is smoke, there must be fire; it is true that where there is smoke, there must be smoke.

As a concession to you, because it's not important, I conceded it was incorrect in saying it was the consensus view. If you want me to use the word "false," then OK, saying it was a consensus view was a false statement. Not sure what else you want said.

To be perfectly honest, I briefly considered cutting-and-pasting that piece, and if I had done so, I would have deleted the first section, the one that dealt with global cooling. I am aware of the facts about that brief moment in time, and it isn't part of the bigger argument. But I thought it was too long to cut-and-paste, and I also thought that the link would help people judge the context by seeing where it came from.


THIS is the IPCC projection (and standard deviation/range of their model runs).

Arctic_models_obs.gif

What aspect of this is too difficult to understand? I get it that some "scientist" or "non-scientist" said 2013 in an interview. But that is NOT what your article is claiming - it is claiming the "scientists" have been wrong on this. The consensus position is in the graph.

Are current observations running BEHIND projections or AHEAD OF projections?
Are ANY of their 'range' of projections showing sea ice below 1 as of 2013? As of 2050?
 
That's because he's ignoring the rest of the story (the same part you deleted from my post).

The prices for waterfront houses were more inflated than non-waterfront houses before the bust, so the waterfront houses have more ground to make up.

That's an opinion. The fact is they are not regaining, and no one wants to be left standing holding the title deed when the music stops and the property value goes to zero.
 
For god's sake, READ your articles BEFORE you link them:

Nationwide, the premium paid for waterfront homes has increased over time, although it has fallen since the housing market peaked in 2007.

Gee, that's EXACTLY what my link said. While the price for houses NOT in flood-prone areas has risen nearly 30%.

Stupid is as stupid does.....:eek:
 
Joe, you realize what you are saying, don't you? Basically, it's that I'm not supposed to believe anything I read about this unless it's something you wrote, because only you are capable of determining what is credible and what is not.

I'm giving you the benefit of the doubt all along in this discussion. I'm not accusing you of cherry-picking your information or charts and graphs, let alone misstating what they say. I'm entirely at your mercy here

Here's another list of various 'models' of Arctic sea ice. NONE show an ice free arctic in 2013.

seaice10.jpg


Maybe you should get your facts from actual factual sources, and NOT Op Eds and random quotes.
 
That's an opinion. The fact is they are not regaining, and no one wants to be left standing holding the title deed when the music stops and the property value goes to zero.

They ARE regaining. The trend line is going up. You know how to read a chart, right?
 
Sigh. OK. I'll believe your charts instead of my lying eyes. Nobody ever said there could be an ice-free arctic in your world, so that's fine.

Joe, I give up. You absolutely refuse to recognize the point I'm making. I know you aren't stupid. I don't know if it's just stubborness, or if its an overreaction to what you perceive as a challenge to one of the tenets of your religion. But there's no point continuing with this.

Here's another list of various 'models' of Arctic sea ice. NONE show an ice free arctic in 2013.

seaice10.jpg


Maybe you should get your facts from actual factual sources, and NOT Op Eds and random quotes.
 
THIS is the IPCC projection (and standard deviation/range of their model runs).

Arctic_models_obs.gif

What aspect of this is too difficult to understand? I get it that some "scientist" or "non-scientist" said 2013 in an interview. But that is NOT what your article is claiming - it is claiming the "scientists" have been wrong on this. The consensus position is in the graph.

Are current observations running BEHIND projections or AHEAD OF projections?
Are ANY of their 'range' of projections showing sea ice below 1 as of 2013? As of 2050?
This chart demonstrates a flawed model.

The unknowns are resulting in observations outside the control limits.

How are we to know what the long term effects of other unknowns will be?
 
This chart demonstrates a flawed model.

The unknowns are resulting in observations outside the control limits.

How are we to know what the long term effects of other unknowns will be?

Yep. And every other IPCC model is lagging behind observations, too.
And the pundits, like Lone Clone's news stories, claim the scientists are being 'too alarmist'.

If ONE model is under-representing risks, while 3 others are accurately mimicking reality, that's one thing.

But we are 4/4 in models telling us we have more time, not less time, to act before things get worse. That's not a case for inaction, by any stretch.
 
Not regaining their previous worth, cupcake.
Context is important sometimes, Forrest.

These data end in April 2014. The market has heated up considerably since then. My wife (no pics) is a realtor. Beachfront property prices in this part of Florida have been rising rapidly.
 
Sometime after the year 2080.
It depends on how much the American taxpayer is willing to spend to defend Miami.

I'm guessing not all that much. Half of Americans don't believe anything needs to be done, so of course they won't want to pay. The other half has been begging people to pay attention and act while we still can, so of course they won't want to pay.

In which case, much sooner than 2080.

How soon probably depends on the methane situation.
 
Waterfront property is not going to be severely threatened by rising seas during the expected life of any structure built today. Just stop with the alarmism.
It's not the fall that kills you, it's the sudden stop.

It may not be the rising sea levels that get you. The storms and floods will do the job first.

Typical con. Always a large percentage of ostrich thinking.
 
These data end in April 2014. The market has heated up considerably since then. My wife (no pics) is a realtor. Beachfront property prices in this part of Florida have been rising rapidly.
Make money while you can on the future misery of buyers. It's the con way - although I forget which of the Ferengi Rules of Acquisition applies.

These are fools' bets.
 
It's not the fall that kills you, it's the sudden stop.

It may not be the rising sea levels that get you. The storms and floods will do the job first.

Typical con. Always a large percentage of ostrich thinking.

:rolleyes:

There have always been storms and floods.

It's not going to become suddenly uninhabitable. There will be gradual change that can be easily managed. It won't be like that stupid "Day After Tomorrow" movie.
 
Nope, that's not what the chart shows. Non-waterfront properties have almost caught up to pre-bust levels and waterfront homes still have a ways to go, but the waterfront homes also had a higher waterfront premium before the crash, so there's more ground to make up.

Really? You're sure? Given your penchant for shoot-from-the-fingertip posting I'm skeptical that you have any idea what your chart shows. Is this waterfront property?

image3.jpg


See? It's facing water. Must be waterfront. On a lake. Does your graph only show those homes located in high risk flood zones? You might want to check. [Hint: Large waterfront home value premiums can be found in Gary, Ind., (790 percent), Holland, Mich. (647 percent), and Grand Haven, Mich. (587 percent)]

Does the lower graph show homes in low risk flood areas? Are these the sum total of your "single-family" homes?

Street_Suburban__2_.JPG


Or does the lower graph indicate something different? (Hint: Overall, the changes in value between waterfront and all homes show similar trends over time, with the values of waterfront homes being more exaggerated (both up and down) than the entire collection of single-family homes nationwide.)

What would the "entire collection of single family homes nationwide" include?

What the hell are you babbling about? The first post I made on this sub-topic said they weren't all beachfront, but you had to go create this ridiculous post?

Do you ever get tired of being a ridiculous troll?
 
:rolleyes:

There have always been storms and floods.

It's not going to become suddenly uninhabitable. There will be gradual change that can be easily managed. It won't be like that stupid "Day After Tomorrow" movie.

“I don’t see how this town is going to defeat the water,” said Brent Dixon, a resident of Miami Beach who plans to move north and away from the coast in anticipation of worsening king tides, the highest predicted tide of the year. “The water always wins.”

...

Florida has six of the 10 American urban centers most vulnerable to storm surge, according to a 2016 report from CoreLogic, a real estate data firm. Southeast Florida experiences about 10 tidal floods per year now. That number is likely to be around 240 floods per year by 2045, according to climate researchers.

Yawn.

Have the evacuated Miami Beach yet?
 
Yawn.

Have the evacuated Miami Beach yet?

You do understand that your vapidity does not in any way count as evidence of anything?


What the hell are you babbling about? The first post I made on this sub-topic said they weren't all beachfront, but you had to go create this ridiculous post?

Do you ever get tired of being a ridiculous troll?

And if the homes in your graph AREN'T beachfront in high risk flood zones they have absolutely no bearing at all on the post to which you responded. Zero.

Do you ever get tired of being ignorant? Does it hurt? It really should. Incentivize learning, you know.
 
Sigh. OK. I'll believe your charts instead of my lying eyes. Nobody ever said there could be an ice-free arctic in your world, so that's fine.

Joe, I give up. You absolutely refuse to recognize the point I'm making.

No. I fully recognize the point you're trying to make; but you're arguing that news quotes equal established science and documented/documentable science models. That's flat out nonsense.

Didn't you work in news media before? You should be well aware how a single quote can be taken totally out of context, repeated and ultimately mean nothing close to what was originally conveyed.

I strongly suspect at least one or two of your soundbite snippets from your link came from an exchange like this, circa 2007:

Reporter: What is happening to the Arctic sea ice?
Scientist: We are seeing an unprecedented drop in ice this year; well beyond any projections anyone has made related to summer sea ice losses.
Reporter: Do you think this will continue?
Scientist: If the trend we are seeing this year were to continue for the next few summer seasons, we will see an ice-free Arctic by 2013 or so.
Reporter: So, the Arctic could be ice free as early as 2013?
Scientist: If the trends were to continue, although it's unlikely we'd have several summers like this in a row.
Then, someone only takes the snippet about "we will see an ice free Arctic by 2013" and runs with it and ignores the rest of the conversation. The scientist never made an outright prediction, only a comment in the unlikely event a trend were extrapolated forward, as unlikely as that trend may be.

Thus, quotes w/o any context of the full interviews are nonsense to claim "scientists told us the Arctic would be ice free by 2013" and "they were outright wrong", when their actual publications and ice loss models were never showing anything of the sort - even the most extreme ones.

This is why you cannot trust random comments, particularly those used in articles like the one you posted. ONLY IF you go to the original article and interview can you gather any context.

And we played this same game with you a year ago, when the 2013 date came out again, and the link you provided was that the Arctic could be ice free by the summer of 2016 ± 3 years. Thus, the prediction cannot yet be assessed until the summer of 2019. And that was merely an offhand comment by a Navy officer (or scientist) who did not do modeling, and was simply eyeballing the current trends. 
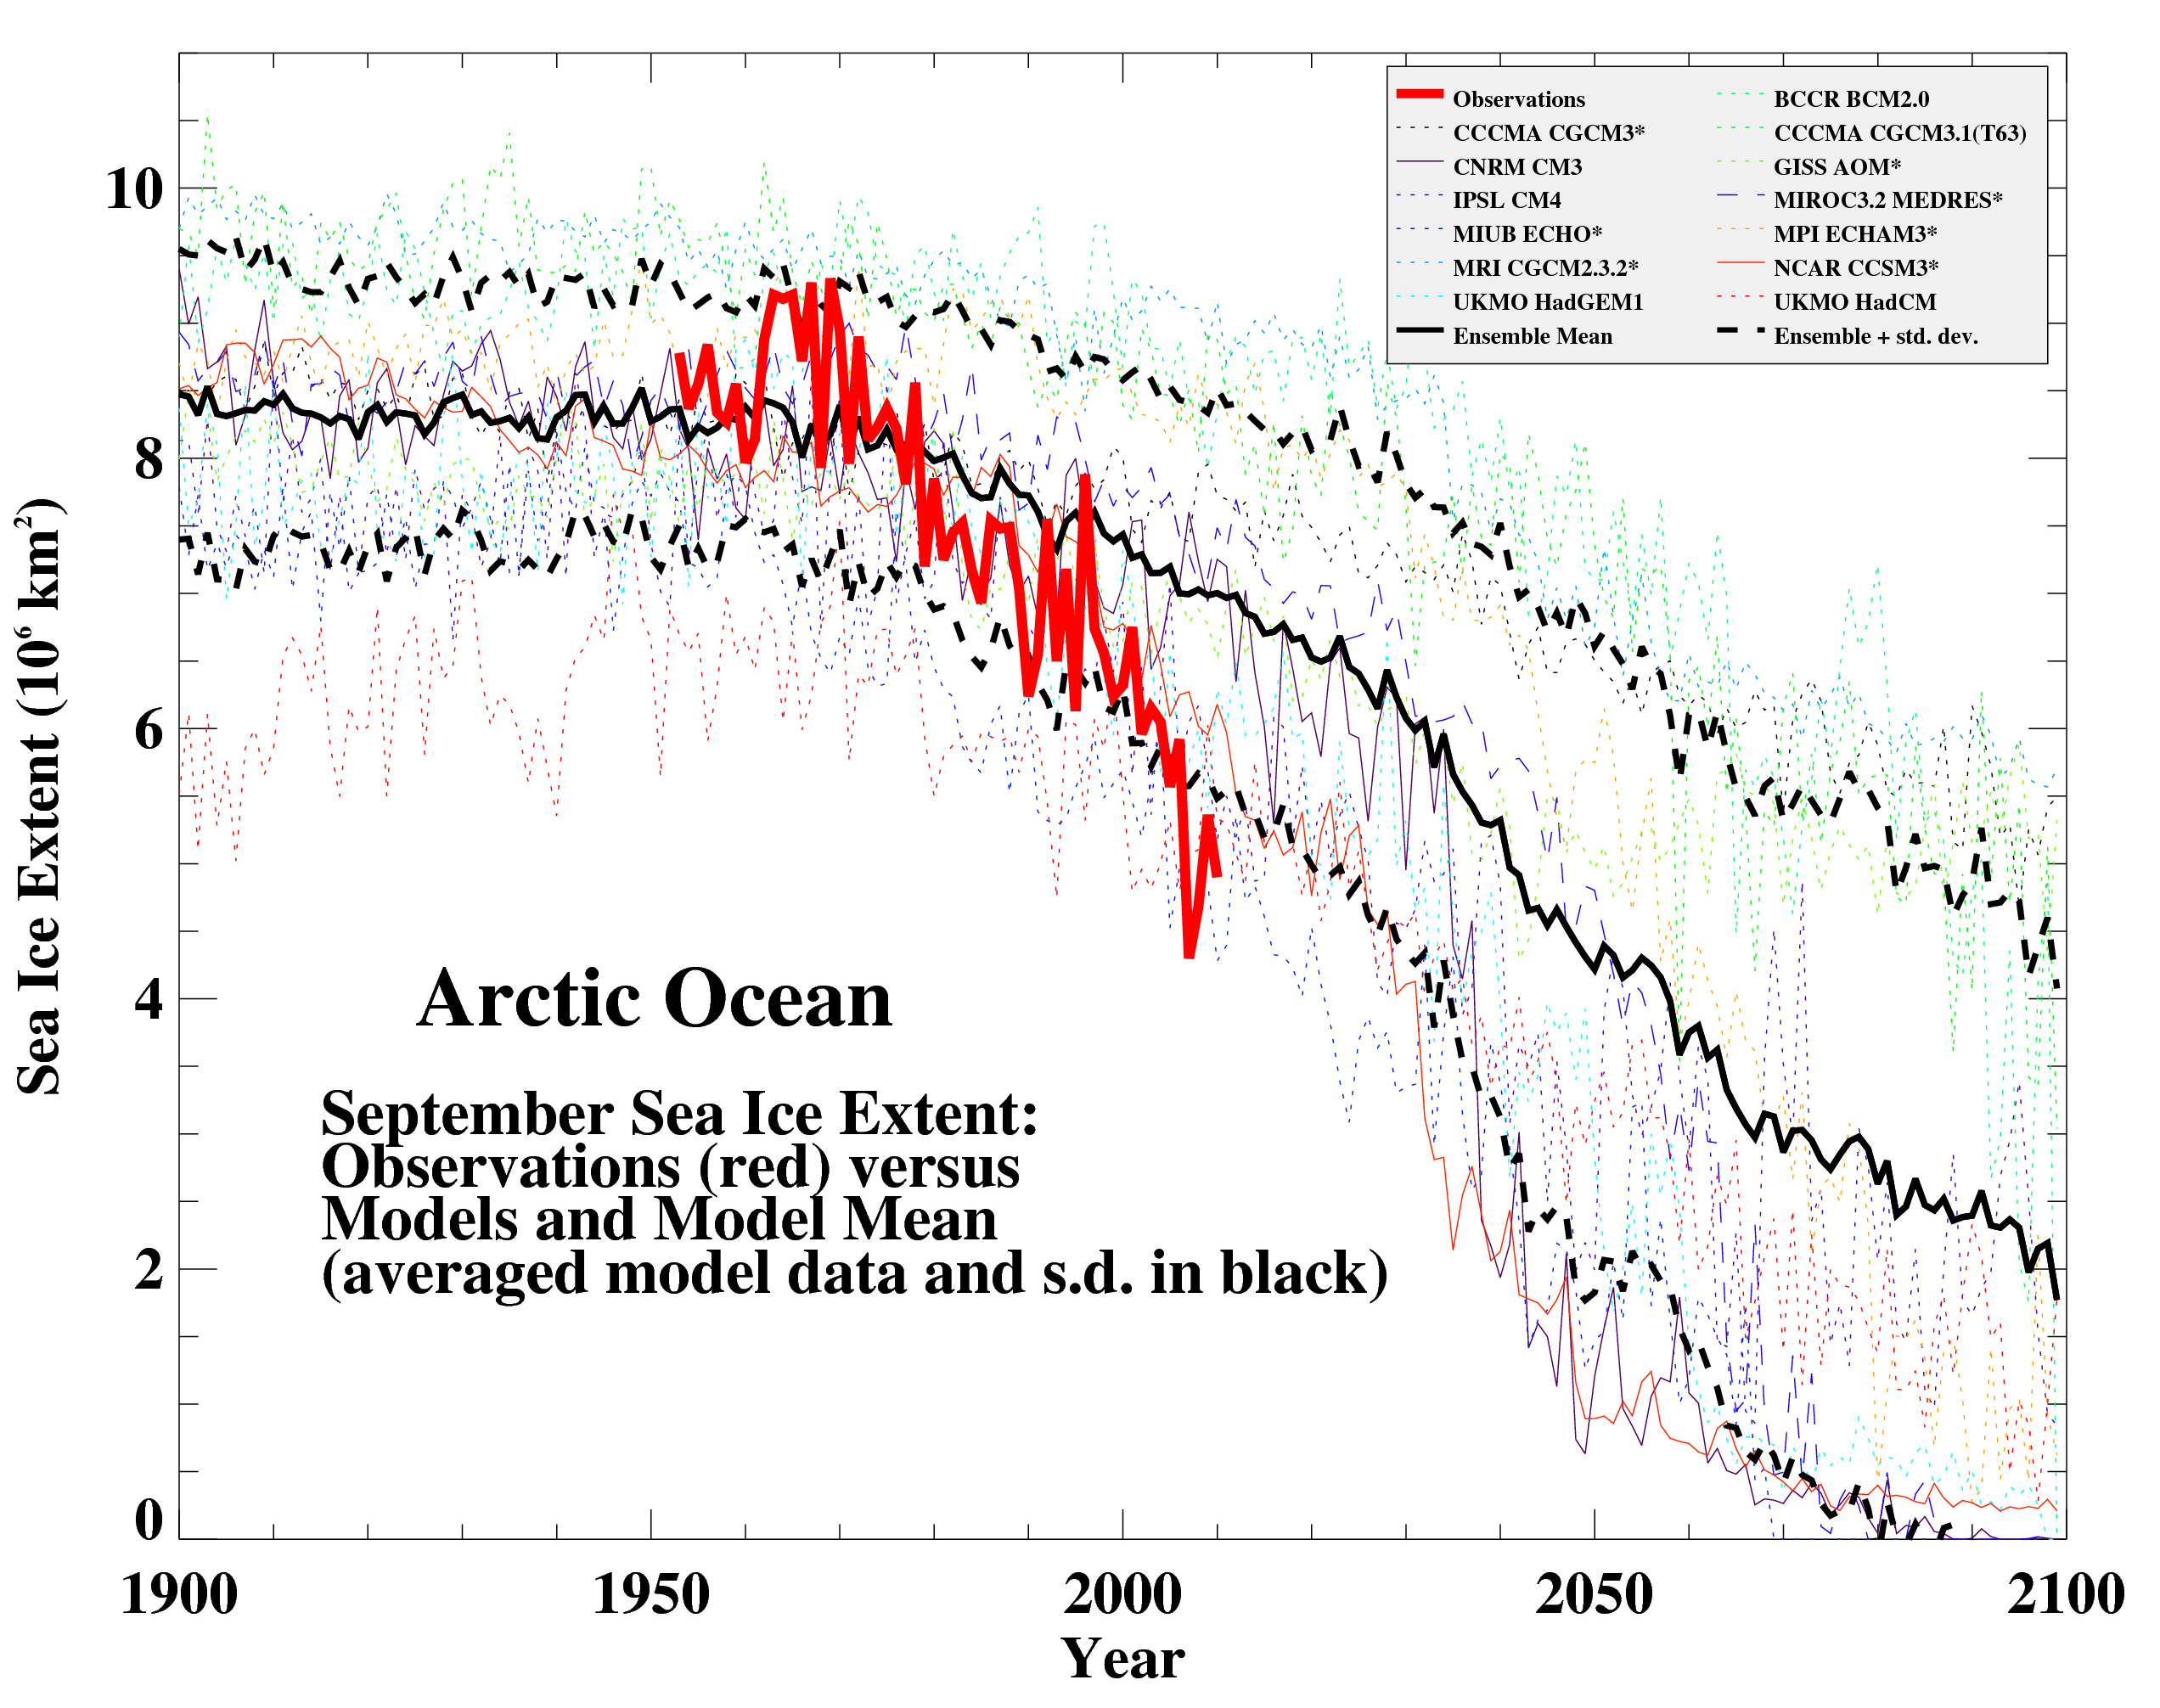
The actual scientific evidence and models ALL project at least 2040 and most are well beyond 2050.

However, since observations are tracking so far below the models, it's becoming more and more likely that we'll see no ice in the Arctic (or the Navy's definition of 'no ice', which is <15% ice coverage) by 2040. And that doesn't mean zero ice, it means navigable sealanes with <15% icepack. That was the OTHER distinction with the quotes from the source article (which were NOT evident in the subsequent denier links).
 
Last edited:
  • Like
Reactions: BelemNole
You do understand that your vapidity does not in any way count as evidence of anything?


And if the homes in your graph AREN'T beachfront in high risk flood zones they have absolutely no bearing at all on the post to which you responded. Zero.

Do you ever get tired of being ignorant? Does it hurt? It really should. Incentivize learning, you know.

NON-beachfront waterfront properties are going to drag the total category down, you idiot. Beachfront is more valuable than riverfront, which is more valuable than lakefront.
 
No. I fully recognize the point you're trying to make; but you're arguing that news quotes equal established science and documented/documentable science models. That's flat out nonsense.
.

Of course that's not what I'm saying. As I think you know. But this is pointless, as I should have known long before this.
 
Of course that's not what I'm saying. As I think you know. But this is pointless, as I should have known long before this.

Same old, same old.

We ran the same broken, skipping record with you on the voter fraud thread. When you provided a news story referring to a report that 'made your point', and when I used the actual report that your link referred to, it stated something entirely different. And then you said I and others were 'changing the subject' by using your own linked report.

You were fooled by an Op Ed taking something out of context from the source then, and you are again now.

Lather.rinse.repeat.
 
But this is pointless, as I should have known long before this.

This is pointless, because despite people explaining the science to you in detail, and providing you with countless actual scientific sources for good material, you never learn anything from it.
 
NON-beachfront waterfront properties are going to drag the total category down, you idiot. Beachfront is more valuable than riverfront, which is more valuable than lakefront.

You really don't understand a thing, do you? Let's take this slow. Beachfront properties in high risk flood zones are still below their price from a decade ago, You get that, right? NOW you lump them in with all waterfront properties whose prices HAVE recovered because they AREN'T in high risk flood areas. The result - as anyone with at least one functioning brain cell would understand, is that you artificially INFLATE the r-e-c-o-v-e-r-y of the homes in the high risk areas because you've lumped them in with homes whose prices HAVE rebounded. Jesus, even a child could understand that what you did doesn't make sense.

We're not talking about today's selling price - we're talking about how prices have behaved over the past decade...before, during, and after the housing crisis. Beachfront homes in high risk flood zones have LOST value - over 4%. Other waterfront homes where flooding isn't an issue HAVE SURPASSED their decade-ago value. For ALL homes - waterfront and otherwise - located outside of high risk flood zones, prices are nearly 30% higher than a decade ago.

LOL! The past decade???

In 2006, we were at the height of the freaking bubble! Everything was obviously overpriced in 2006. THAT'S your baseline for your argument????

And again, the high-premium properties were disproportionately "pumped up" by the bubble.

So again, you're talking in circles. You can't compare prices to the top of the bubble.

G F Y S.
 
This is pointless, because despite people explaining the science to you in detail, and providing you with countless actual scientific sources for good material, you never learn anything from it.
Whatever helps you sleep at night, Joe.
 
LOL! The past decade???

In 2006, we were at the height of the freaking bubble! Everything was obviously overpriced in 2006. THAT'S your baseline for your argument????

And again, the high-premium properties were disproportionately "pumped up" by the bubble.

So again, you're talking in circles. You can't compare prices to the top of the bubble.

G F Y S.

Getting testy, eh? Height of the bubble, eh? Yet, absent those high-risk beachfront properties, housing prices for ALL other homes are nearly 30% above that bubble price. If they were overpriced THEN - and you claimed "everything" was - what are they now? SUPER-overpriced? LOL

You really have further exposed your lack of intelligence here. But don't stop...it's mildly entertaining watching you twist at the end of your own rope.

Go back and look at the chart, read the Zillow analysis, and then come back and tell me that the bubble had equal effects on waterfront vs. non-waterfront properties.

Sheesh, what a maroon.
 
Whatever helps you sleep at night, Joe.

This doesn't help anyone sleep better at night. Because there are millions of other people just like you who refuse to respect science and scientific inquiry. They refuse to rely on experts and instead they rely on sensationalist right wing blog sites all because they are on your "team".
 
  • Like
Reactions: Joes Place
ADVERTISEMENT
ADVERTISEMENT