America’s post-pandemic recovery has left Europe in the dust
 www.ft.com
The US economy is soaring. It grew at an annualised 4.9 per cent pace in the third quarter. That followed three quarters where growth exceeded the 2 per cent or so many people see as the long-term speed limit. My colleagues over at the FT Unhedged newsletter illustrate how this growth shows up in strong US business results, too. Meanwhile, Europe is stagnating. The transatlantic difference is the topic of today’s column.
But first a pro tip for Free Lunch readers: join The Global Boardroom on November 8-10, when FT journalists meet leaders in government and business, including the European Central Bank president, the Bank of Japan governor and the World Bank Group’s chief economist. Register for free today.
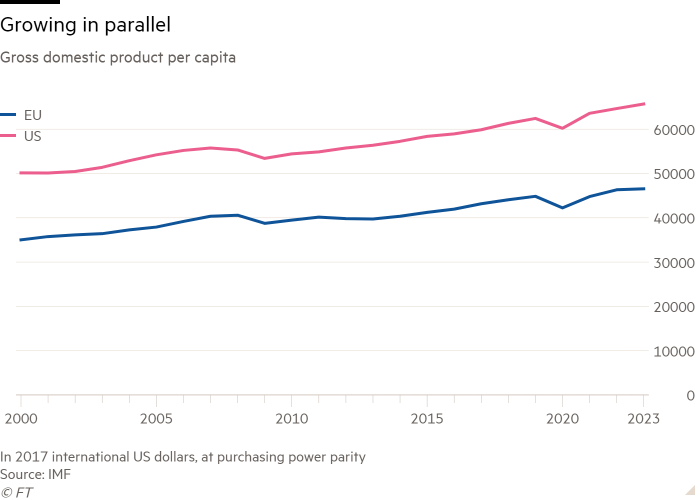
The divergence between the US and the EU economies is astonishing. That is not a statement about the long run. While the US has grown much more than Europe this century, that is virtually all down to different rates of population growth. If you compare inflation-adjusted gross domestic product per capita, expressed in internationally comparable currency, the EU and US have performed identically since 2000, as the chart below shows. The EU’s GDP/capita (which, remember, includes the poorer countries of central, eastern and south-eastern Europe) has hovered around 70 to 73 per cent of the US’s throughout the period.

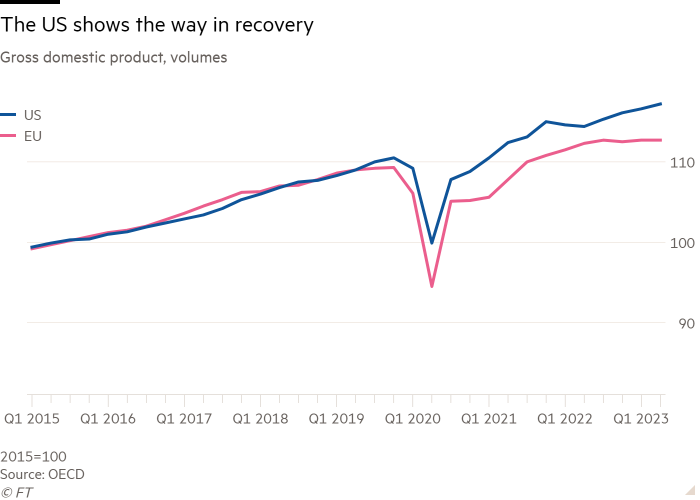
Since the pandemic, though, the two regions have diverged massively. Both recovered better than anyone had expected — but the US much more so than the EU. As the chart below shows, the US passed its pre-pandemic peak in early 2021, half a year before the EU. Then, the US briefly stagnated while the EU picked up. But now the divergence is widening: where the US accelerates from an already healthy pace, the EU and the eurozone have flatlined for a year. And if we compare current GDP with the 2015-19 trend, the most recent growth burst means the US falls just 1 to 2 per cent short, much better than Europe’s 5 per cent shortfall.

So while the transatlantic economic race is a dead heat over the long run, this round has been won by the US. This raises the interesting question of why. As the US Treasury has pointed out, much of the growth comes down to US households, whose consumption and investment are strong and getting stronger. But what — in particular, which policy choices — can explain this domestic demand exuberance relative to Europe?
Let’s first note that the two have had pretty similar monetary policy. The Federal Reserve has raised rates by 5.25 percentage points since it started tightening. The European Central Bank (which sets rates for 5/6ths of the EU economy) has raised them by 4.5.
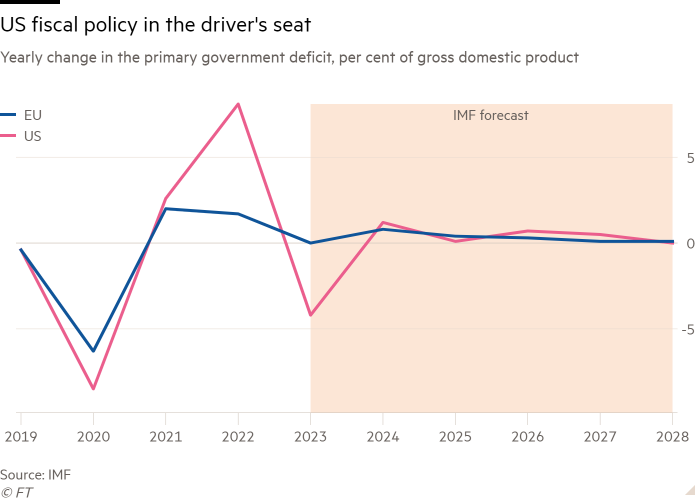
The obvious other suspect is fiscal policy. And here there is a big difference. The next chart shows one measure of fiscal stimulus: the change in the government’s primary (before debt service) deficit in the US and the EU. America’s increase in 2020 was more than 2 percentage points of GDP larger than the EU’s. (Budget tightening in 2022 was much stronger, according to IMF data, which fits with how America’s recovery stumbled more than Europe’s that year.)

And unlike European finance ministries, Washington has allowed the deficit to widen a lot again this year — in the IMF’s estimate the US primary deficit will increase by 4.2 per cent of GDP compared with 2022 while the average in the EU will not change at all. Admittedly, other methodologies give different results: the Hutchins Center’s fiscal impact measure puts the current impact at about zero — but that’s at least a huge improvement on the strongly negative impact it attributes to US government budgets last year.
In addition, some US policies were more progressive than Europe’s. They focused on unemployment benefits, which were temporarily made very generous, for those who lost their jobs rather than on wage support for those who kept them but were temporarily furloughed. The US also saw significant wage compression as the strong labour market in the recovery raised wages faster at the bottom than at the top. All this, plus the direct cash distributions Washington opted for several times, made for a much larger accumulation of unspent money in the US than in Europe, and more of it in liquid assets. My colleague Soumaya Keynes recently wrote about this. A recent research note from UniCredit economists also charts these developments in some detail, and adds that overall net worth increased more in the US than in the EU (due to asset prices), which may also have boosted consumer spending. They conclude, however, that the spur to spending may be coming to an end about now.
Is it all down to different fiscal policies, then? My colleague Chris Giles (whose new central banking newsletter you should sign up to) has pointed out that the energy price shock also affected the US and Europe very differently. The US is (just about) a net energy exporter with huge domestic production of oil and gas, whereas the EU is seriously import-dependent. That obviously matters for inflationary pressures (though inflation has behaved quite similarly in the two regions) but should matter for growth, too.
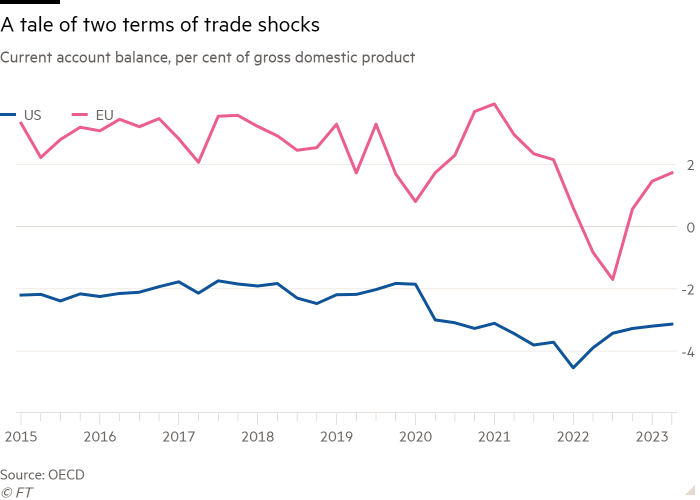
The different “terms of trade shocks” — for the non-economists, that means a change in the relative prices of what you import and what you export — are evident if you look at how the two regions’ trade balances evolved through the crisis. The EU’s current account, which has long been in large structural surplus, fell into deficit in 2022. The US’s didn’t move much; if anything, the shock was positive.

I am not entirely convinced, however, that this can explain the difference in growth performance. For if the EU had a large negative terms of trade shock last year, it has had a large positive one this year, as global energy and food prices came down. So if anything, we should have seen the US outperform the EU in 2022 and vice versa this year; the opposite has happened. It is, of course, possible that we are watching a delayed effect — in which case Europe’s prospects may be rosier than they appear.
Free Lunch readers may have their own explanations — do share them with me. Here is one intriguing possibility: some thought that the US willingness to let people lose their jobs in the pandemic would allow for more productive reallocation later. Is there any evidence of this playing out? Send me your thoughts at freelunch@ft.com.
What the US got right that Europe did not
America’s post-pandemic recovery has left Europe in the dust
The US economy is soaring. It grew at an annualised 4.9 per cent pace in the third quarter. That followed three quarters where growth exceeded the 2 per cent or so many people see as the long-term speed limit. My colleagues over at the FT Unhedged newsletter illustrate how this growth shows up in strong US business results, too. Meanwhile, Europe is stagnating. The transatlantic difference is the topic of today’s column.
But first a pro tip for Free Lunch readers: join The Global Boardroom on November 8-10, when FT journalists meet leaders in government and business, including the European Central Bank president, the Bank of Japan governor and the World Bank Group’s chief economist. Register for free today.
The divergence between the US and the EU economies is astonishing. That is not a statement about the long run. While the US has grown much more than Europe this century, that is virtually all down to different rates of population growth. If you compare inflation-adjusted gross domestic product per capita, expressed in internationally comparable currency, the EU and US have performed identically since 2000, as the chart below shows. The EU’s GDP/capita (which, remember, includes the poorer countries of central, eastern and south-eastern Europe) has hovered around 70 to 73 per cent of the US’s throughout the period.

Since the pandemic, though, the two regions have diverged massively. Both recovered better than anyone had expected — but the US much more so than the EU. As the chart below shows, the US passed its pre-pandemic peak in early 2021, half a year before the EU. Then, the US briefly stagnated while the EU picked up. But now the divergence is widening: where the US accelerates from an already healthy pace, the EU and the eurozone have flatlined for a year. And if we compare current GDP with the 2015-19 trend, the most recent growth burst means the US falls just 1 to 2 per cent short, much better than Europe’s 5 per cent shortfall.

So while the transatlantic economic race is a dead heat over the long run, this round has been won by the US. This raises the interesting question of why. As the US Treasury has pointed out, much of the growth comes down to US households, whose consumption and investment are strong and getting stronger. But what — in particular, which policy choices — can explain this domestic demand exuberance relative to Europe?
Let’s first note that the two have had pretty similar monetary policy. The Federal Reserve has raised rates by 5.25 percentage points since it started tightening. The European Central Bank (which sets rates for 5/6ths of the EU economy) has raised them by 4.5.
The obvious other suspect is fiscal policy. And here there is a big difference. The next chart shows one measure of fiscal stimulus: the change in the government’s primary (before debt service) deficit in the US and the EU. America’s increase in 2020 was more than 2 percentage points of GDP larger than the EU’s. (Budget tightening in 2022 was much stronger, according to IMF data, which fits with how America’s recovery stumbled more than Europe’s that year.)

And unlike European finance ministries, Washington has allowed the deficit to widen a lot again this year — in the IMF’s estimate the US primary deficit will increase by 4.2 per cent of GDP compared with 2022 while the average in the EU will not change at all. Admittedly, other methodologies give different results: the Hutchins Center’s fiscal impact measure puts the current impact at about zero — but that’s at least a huge improvement on the strongly negative impact it attributes to US government budgets last year.
In addition, some US policies were more progressive than Europe’s. They focused on unemployment benefits, which were temporarily made very generous, for those who lost their jobs rather than on wage support for those who kept them but were temporarily furloughed. The US also saw significant wage compression as the strong labour market in the recovery raised wages faster at the bottom than at the top. All this, plus the direct cash distributions Washington opted for several times, made for a much larger accumulation of unspent money in the US than in Europe, and more of it in liquid assets. My colleague Soumaya Keynes recently wrote about this. A recent research note from UniCredit economists also charts these developments in some detail, and adds that overall net worth increased more in the US than in the EU (due to asset prices), which may also have boosted consumer spending. They conclude, however, that the spur to spending may be coming to an end about now.
Is it all down to different fiscal policies, then? My colleague Chris Giles (whose new central banking newsletter you should sign up to) has pointed out that the energy price shock also affected the US and Europe very differently. The US is (just about) a net energy exporter with huge domestic production of oil and gas, whereas the EU is seriously import-dependent. That obviously matters for inflationary pressures (though inflation has behaved quite similarly in the two regions) but should matter for growth, too.
The different “terms of trade shocks” — for the non-economists, that means a change in the relative prices of what you import and what you export — are evident if you look at how the two regions’ trade balances evolved through the crisis. The EU’s current account, which has long been in large structural surplus, fell into deficit in 2022. The US’s didn’t move much; if anything, the shock was positive.

I am not entirely convinced, however, that this can explain the difference in growth performance. For if the EU had a large negative terms of trade shock last year, it has had a large positive one this year, as global energy and food prices came down. So if anything, we should have seen the US outperform the EU in 2022 and vice versa this year; the opposite has happened. It is, of course, possible that we are watching a delayed effect — in which case Europe’s prospects may be rosier than they appear.
Free Lunch readers may have their own explanations — do share them with me. Here is one intriguing possibility: some thought that the US willingness to let people lose their jobs in the pandemic would allow for more productive reallocation later. Is there any evidence of this playing out? Send me your thoughts at freelunch@ft.com.
Last edited:


