
So this is informational with some fun exercises of bad math to boot. @Joes Place will no doubt try to poke holes in this and say it’s not just death but myocarditis blah blah blah.
 jamanetwork.com
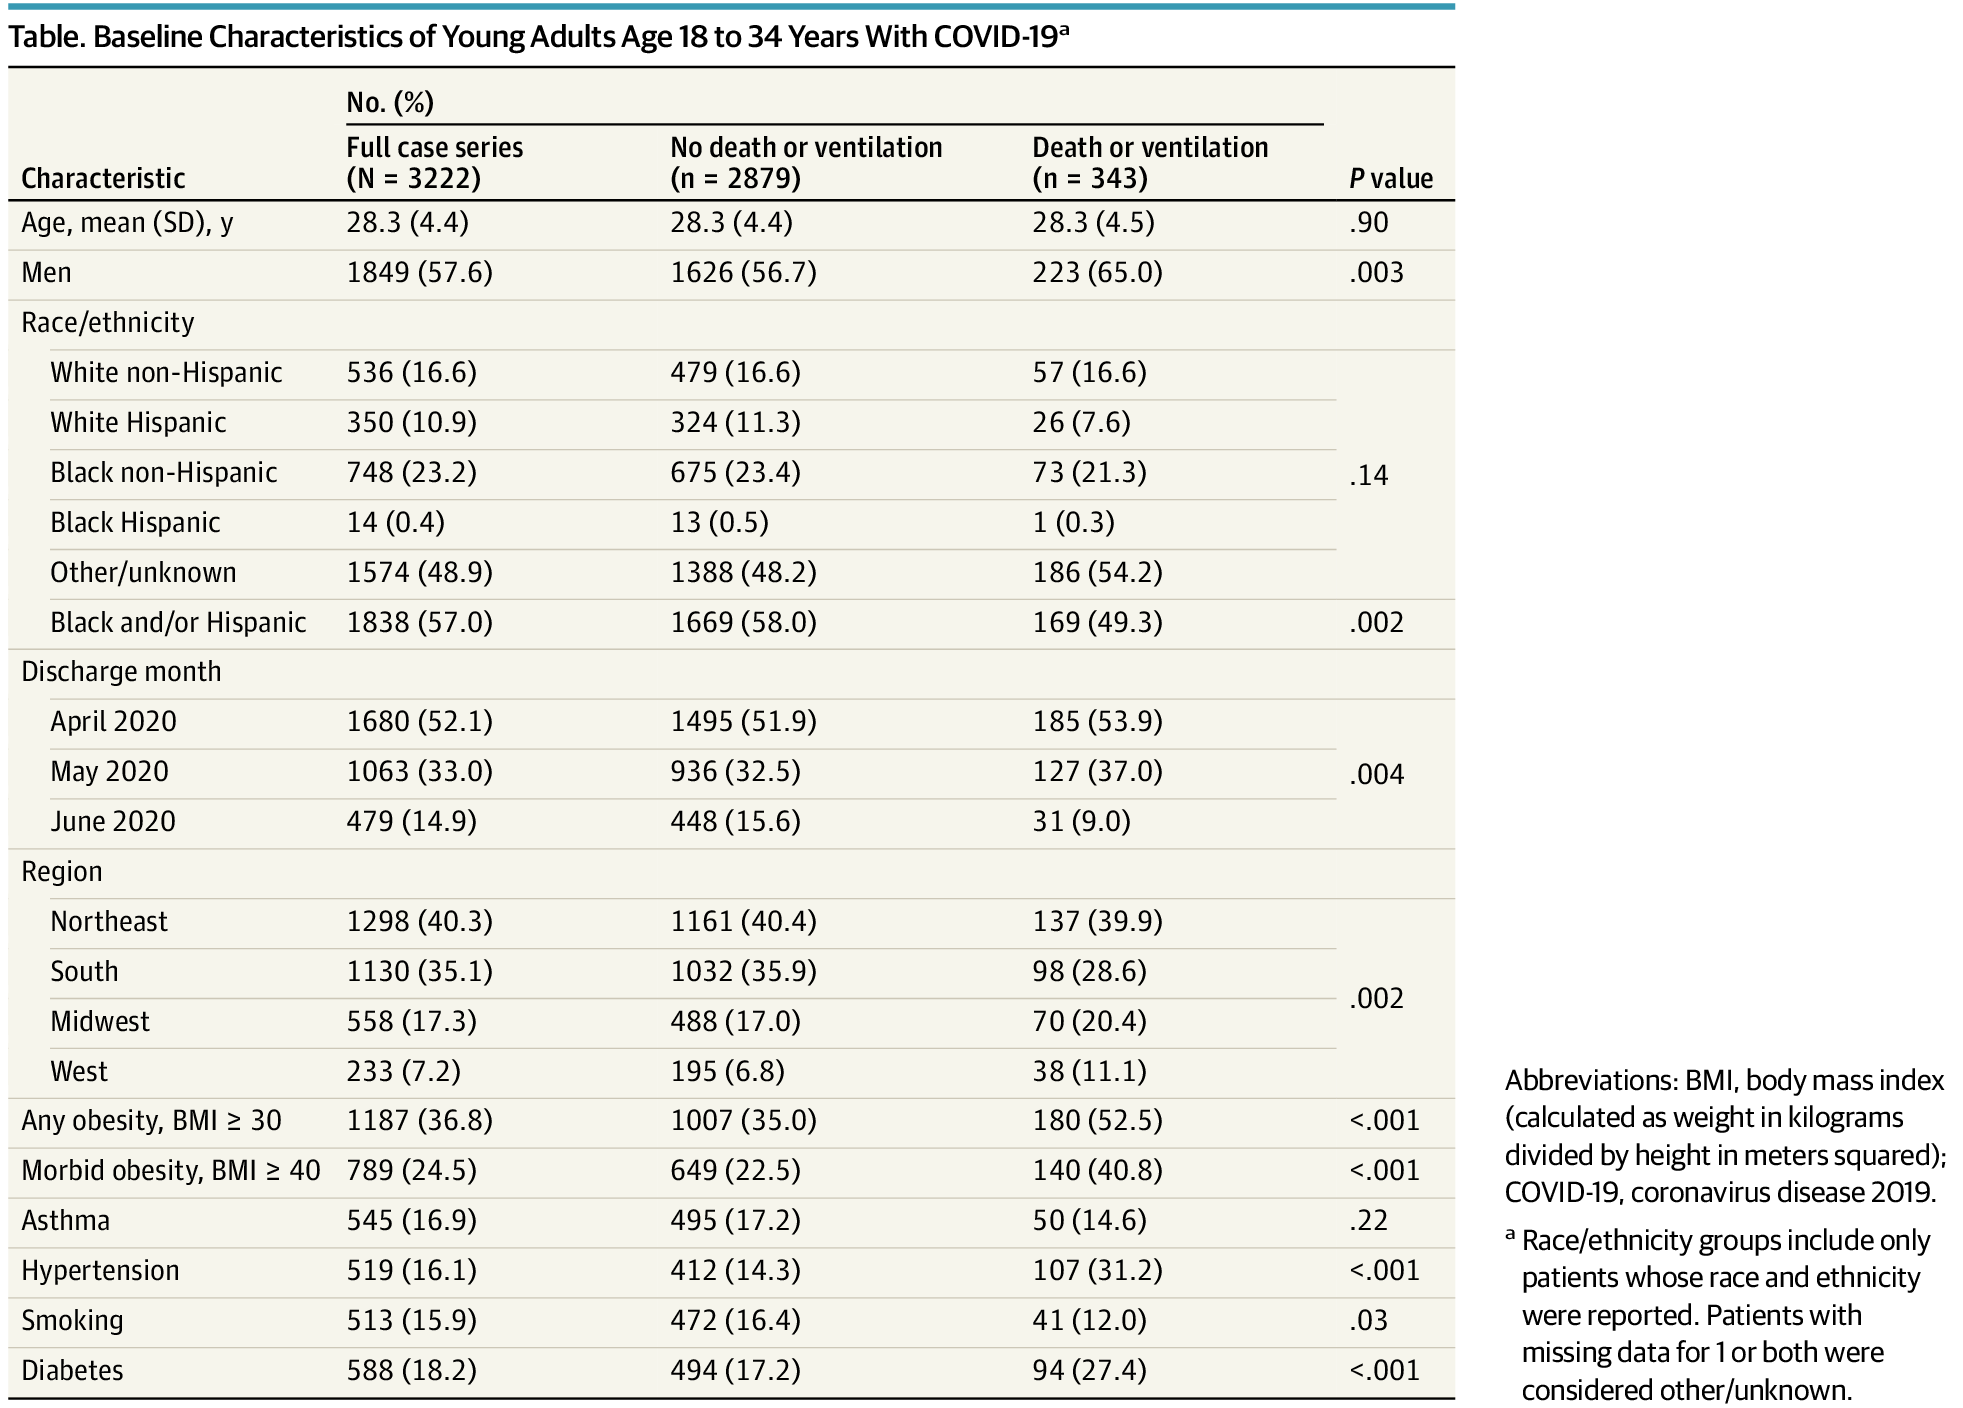
“Among 780 969 adults discharged between April 1, 2020, and June 30, 2020, 63 103 (8.1%) had the ICD-10 code for COVID-19, of whom 3222 (5%) were nonpregnant young adults (age 18-34 years) admitted to 419 US hospitals. The mean (SD) age of this population was 28.3 (4.4) years; 1849 (57.6%) were men and 1838 (57.0%) were Black or Hispanic. Overall, 1187 (36.8%) had obesity, 789 (24.5%) morbid obesity, 588 (18.2%) diabetes, and 519 (16.1%) hypertension (Table).”
Note that this means that of all hospitalized patients between April 1 and June 30th in the group studied the chance of death for an 18-34 year old is .01%.
This doesn’t even take into account the number of those not hospitalized. One really can’t extrapolate to the general population without knowing the overall population of those communities that these 1k plus hospitals serve. But one can easy state I think that it is at least 1 order and likely 2 orders or more, of magnitude lower.
Some amateur (relax it’s just for fun all you actuaries) analysis. I’m not trying to form conclusions with this. Just stabbing at what could be the application to the US as a whole.
One possible way to estimate it might be that there are 1k hospitals in this study and 6k hospitals in the US. That method is clearly fraught with error but just a comparison about what we are talking about here.
Another, possibly closer but more complex, estimate would be this......
There are 36 million hospital admissions annually. So this period is 3 months. So 1/4 of that is 9 million admissions country wide in an average 3 month period, if admissions is a constant which is a big assumption. This was 780k of them. So this sample COULD be representative of 8.6% of the US population assuming, I know it’s massively, that admissions in this group of hospitals is representative of 8.6% of the US. This is 28 million people. So if all these assumptions are close, this is 88 deaths in the 18-34 age group out of 28 million people. That’s .0003%.
The real mathematicians on here can no doubt provide a better analysis than i but the main point is that this study likely can’t ok approximate much of anything and really simply says what it does. That the risk of death in hospitalized patients with Covid in this sample of 18-36 year olds was . 01%
Anyway based on my expert opinion let’s play football!
If someone wants to forward my statistical analysis to the BIG I’ll provide my contact info") .
.
Clinical Outcomes in Young US Adults Hospitalized With COVID-19
This case series examines the clinical outcomes for young adults hospitalized with COVID-19.
jamanetwork.com
“Among 780 969 adults discharged between April 1, 2020, and June 30, 2020, 63 103 (8.1%) had the ICD-10 code for COVID-19, of whom 3222 (5%) were nonpregnant young adults (age 18-34 years) admitted to 419 US hospitals. The mean (SD) age of this population was 28.3 (4.4) years; 1849 (57.6%) were men and 1838 (57.0%) were Black or Hispanic. Overall, 1187 (36.8%) had obesity, 789 (24.5%) morbid obesity, 588 (18.2%) diabetes, and 519 (16.1%) hypertension (Table).”
Note that this means that of all hospitalized patients between April 1 and June 30th in the group studied the chance of death for an 18-34 year old is .01%.
This doesn’t even take into account the number of those not hospitalized. One really can’t extrapolate to the general population without knowing the overall population of those communities that these 1k plus hospitals serve. But one can easy state I think that it is at least 1 order and likely 2 orders or more, of magnitude lower.
Some amateur (relax it’s just for fun all you actuaries) analysis. I’m not trying to form conclusions with this. Just stabbing at what could be the application to the US as a whole.
One possible way to estimate it might be that there are 1k hospitals in this study and 6k hospitals in the US. That method is clearly fraught with error but just a comparison about what we are talking about here.
Another, possibly closer but more complex, estimate would be this......
There are 36 million hospital admissions annually. So this period is 3 months. So 1/4 of that is 9 million admissions country wide in an average 3 month period, if admissions is a constant which is a big assumption. This was 780k of them. So this sample COULD be representative of 8.6% of the US population assuming, I know it’s massively, that admissions in this group of hospitals is representative of 8.6% of the US. This is 28 million people. So if all these assumptions are close, this is 88 deaths in the 18-34 age group out of 28 million people. That’s .0003%.
The real mathematicians on here can no doubt provide a better analysis than i but the main point is that this study likely can’t ok approximate much of anything and really simply says what it does. That the risk of death in hospitalized patients with Covid in this sample of 18-36 year olds was . 01%
Anyway based on my expert opinion let’s play football!
If someone wants to forward my statistical analysis to the BIG I’ll provide my contact info
.
Last edited: