
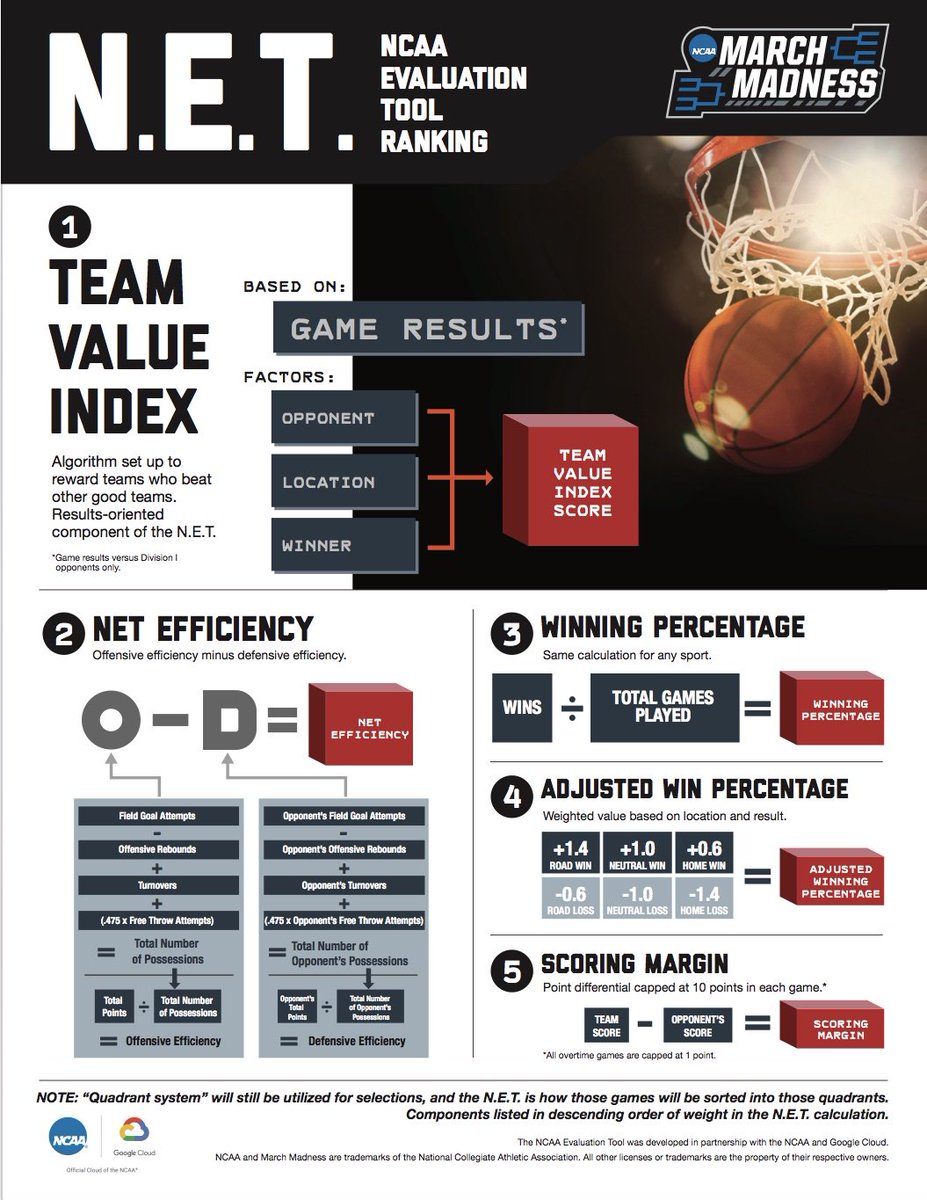
Interesting graphic on the NET ranking (see below).
The very latest NET rankings for all 353 teams can be found here: https://www.ncaa.com/rankings/basketball-men/d1/ncaa-mens-basketball-net-rankings
Also, what follows is some more good info on how teams will be selected for the NCAA Tournament. Go here to read more: https://www.ncaa.com/news/basketbal...-what-know-about-college-basketballs-new-tool
As a reminder:
* 32 teams receive automatic bids to the NCAA tournament by winning their conference tournament.
* The NCAA Selection committee only selects the 36 teams who receive at-large bids.
Today (March 17) Iowa is #43 in the NET Rankings. Right now are we looking at an 8, 9, or 10 (?!?) seed for the NCAA Tournament?
TWO things will be used by the NCAA Selection Committee when selecting the NCAA Tournament Teams & then seeding them:
(1) The NET ranking, an index that incorporates the most current evaluation measures; and
(2) A tighter definition of a quality win, classifying wins as Quad 1, Quad 2, Quad 3 and Quad 4.
The hope is that by using (1) and (2) we will have a more accurate selection and seeding procedure.
The quadrant system will still be used on team sheets, which sort results in the following manner:
To date, WHAT FOLLOWS are the Iowa (22-11) Quadrant WINS & LOSSES. NOTE that:
* The date of the opponent's NET Ranking is listed.
* Similar to the NET ranking, a Quad 1 win on the date listed might not be a Quad 1 win TODAY or in mid March (there has been fluidity). Time will tell.
SORTING OF #43 (NET Rank) IOWA'S RESULTS (22-11) INTO THE 4 QUADS:
Quadrant 1 (4-10): Home vs a 1-30 team, Neutral site vs 1-50, Away vs 1-75.
WINS
# 24 on Jan 16 (H) Iowa State
#60 on Feb 23; #84 on Jan 17 (A) Penn State
#2 on Jan 17 Michigan (H)
#54 on Feb 23; #30 on Jan 17 Indiana (A)
LOSSES
# 20 on Jan 16 (H) Wisconsin
#7 on Jan 16 (A) Michigan State
#17 on Jan 16 (A) Purdue
#6 on Jan 17 Michigan State (H)
#63 on Jan 17 Minnesota (A)
#21 on Jan 17 Maryland (H)
#36 on Jan 17 Ohio State (A)
#22 on Jan 17 Wisconsin (A)
#46 on Feb 23; #11 on Jan 17 Nebraska (A)
#9 on March 16 Michigan (B1G Tourney, Neutral site)
Quadrant 2 (7-0): Home vs a 31-75, Neutral site vs 51-100, Away vs 76-135.
WINS
#77 on Jan 16 (N) Oregon
#88 on Jan 16 (N) UConn
#85 on Feb 23; # 58 on Jan 16 (A) Northwestern
# 36 on Jan 16 (H) Ohio State
#46 on Feb 23; # 10 on Jan 16 (H) Nebraska
#109 on Feb 23; #136 on Jan 17 Rutgers (A)
#54 on Feb 23; #30 on Jan 17 Indiana (H)
Quadrant 3 (5-1): Home vs a 76-160, Neutral site vs 101-200, Away vs 135-240.
WINS
#112 on Feb 23; #53 on Jan 16 (H) Pittsburgh
#169 on Feb 23; #217 on Jan 16 (N) UNI
#99 on Jan 17 Illinois (H)
#85 on Feb 23; #59 on Jan 17 Northwestern (H)
#109 on March 15 Illinois (B1G Tourney, Neutral site)
LOSSES
#94 on March 3; #109 on Feb 23; #136 on Jan 17 Rutgers (H)
Quadrant 4 (6-0): Home vs a 161-353, Neutral vs 201-353, Away vs 241-353
WINS
#234 on Jan 16 (H) UMKC
#192 on Jan 16 (H) Green Bay
#324 on Jan 16 (H) Alabama State
#269 on Jan 16 (H) Western Carolina
#343 on Jan 16 (H) Savannah State
#316 on Jan 16 (H) Bryant
0 games left on the reg season schedule:
Quadrant 1 (0 games): Home vs a 1-30 team, Neutral site vs 1-50, Away vs 1-75
NONE LEFT ON THE SCHEDULE
.
Quadrant 2 (0 games): Home vs a 31-75, Neutral site vs 51-100, Away vs 76-135.
NONE LEFT ON THE SCHEDULE
Quadrant 3 (0 games): Home vs a 76-160, Neutral site vs 101-200, Away vs 135-240.
NONE LEFT ON THE SCHEDULE
Quadrant 4 (0 games): Home vs a 161-353, Neutral vs 201-353, Away vs 241-353
NONE LEFT ON THE SCHEDULE
_______________________________
Previous NET Rankings for Iowa (notice the fluidity):
#43 on March 17 (SELECTION SUNDAY) after TWO TEAMS IOWA BEAT (Iowa State & Oregon) won their conf championship AND Michigan & Mich State (IOWA was 1-3 vs them) advanced to the BTT Championship
#44 on March 16 (after losing to #9 Michigan in BTT)
#41 on March 15 (after beating #109 Illinois in BTT)
#43 on March 14
#42 on March 11 (day after loss AT Nebraska)
#43 on March 10
#45 on March 8
#41 on March 7
#40 on March 5
#41 on March 3 & 4
#33 on Feb 28 (was idle)
#32 on Feb 27 (day after loss AT Ohio St)
#30 on Feb 22, 23 and 24
#29 on Feb 13 & 14
#26 on Feb 10, 11 & 12
#24 on Feb 7
#22 on Feb 2 (after Feb 1's 15 pt home win vs Michigan)
#27 on Jan 30 & Jan 31
#28 on Jan 29
#30 on Jan 28
#25 on Jan 27
#24 on Jan 26
#22 on Jan 23
#25 on Jan 22
#25 on Jan 19
#24 on Jan 18
#29 on Jan 13
#35 on Jan 12
_______________________________
To see all teams' NET Rankings & quadrant results, open the link that follows, scroll down on the page that comes up & on the far right you will see NET Team Sheets - Games through [date]. Click on the most recent link or a previous date.
LINK: https://extra.ncaa.org/solutions/rpi/SitePages/Home.aspx
_______________________________
ALL B1G TEAMS' CURRENT (MARCH 17) NET RANKINGS:
Rank..Previous..Road..Neutral..Home..Non Div 1
8 8 Michigan St. Big Ten 27-6 8-4 4-1 15-1 0-0
9 9 Michigan Big Ten 28-5 7-4 4-0 17-1 0-0
12 12 Purdue Big Ten 23-9 6-6 2-3 15-0 0-0
17 17 Wisconsin Big Ten 23-10 8-5 3-2 12-3 0-0
27 27 Maryland Big Ten 22-10 6-5 1-2 15-3 0-0
43 44 Iowa Big Ten 22-11 4-6 4-1 14-4 0-0
48 48 Nebraska Big Ten 18-16 2-9 4-2 11-5 1-0
50 49 Penn St. Big Ten 14-18 4-9 1-3 9-6 0-0
54 53 Indiana Big Ten 17-15 3-9 1-1 13-5 0-0
55 55 Ohio St. Big Ten 19-14 5-7 2-1 12-6 0-0
61 57 Minnesota Big Ten 21-13 2-9 6-1 13-3 0-0
89 88 Northwestern Big Ten 13-19 1-9 2-2 10-8 0-0
101 100 Rutgers Big Ten 14-17 4-9 0-1 10-7 0-0
109 109 Illinois Big Ten 12-21 1-9 2-5 9-7 0-0
_______________________________
CLICK ON IMAGE FOR LARGER VIEW
Last edited:


 Jon Miller@hawkeyenation